U.S. Soybean Outlook: 2018/19 Lower Production and Exports and Higher Ending Stocks
Author
Published
11/12/2018
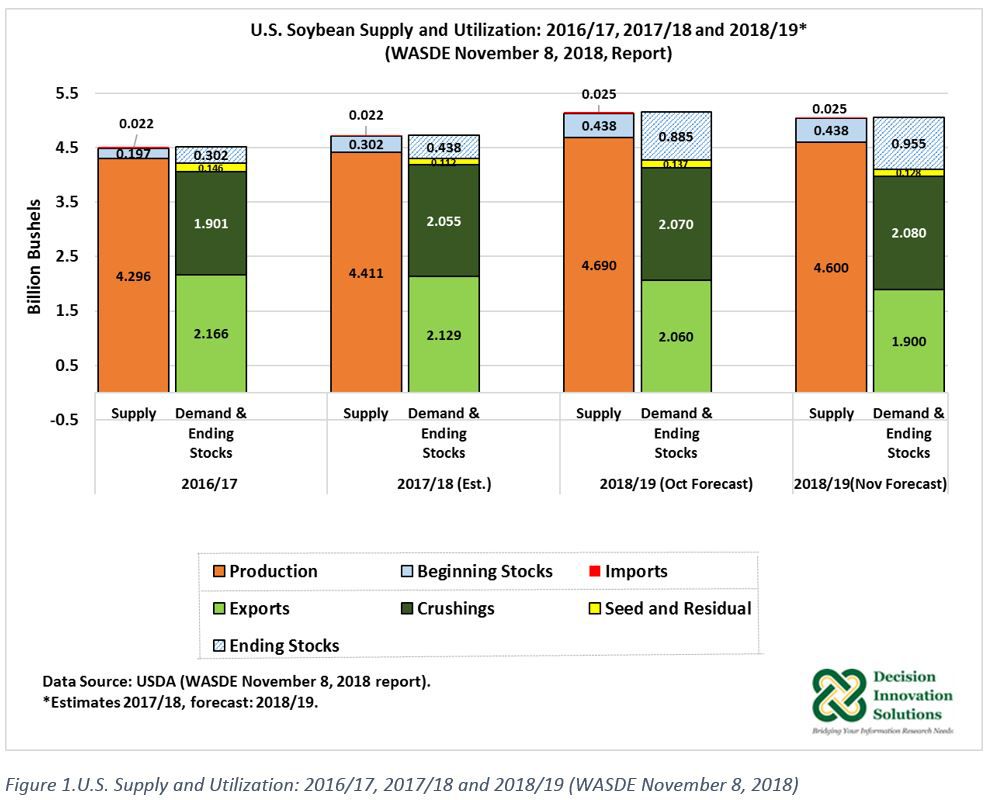
USDA’s November 8, 2018, edition of the World Agricultural Supply and Demand Estimates Report (WASDE) contains the latest forecast for the 2018/19 soybean marketing year. Compared with last month’s outlook, U.S. soybean production is projected down 90 million bushels to record 4.600 billion bushels (see Figure 1). This reflects a 2 percent yield reduction to 52.1 bushels per acre from last month’s projection. The latest yield forecast is based on expected yield reductions for several states, including top producers such as Iowa and Illinois. Based on November 1 conditions, USDA’s Crop Production report indicates Iowa’s latest yield is projected at 58 bushels per acre compared with 61 last month. Illinois’ yield is reduced from 66 bushels per acre to 64. If achieved, Iowa’s yield would be the second largest after 2016 (60 bushels per acre), whereas for Illinois the projected yield would be the highest on record. Iowa and Illinois are expected to have record high productions at 576.5 million bushel and 688.0 million bushels, respectively.
2018/19 U.S. total soybean supply is forecast down 2 percent from last month to 5.063 billion bushels, but up 6.9 percent from the previous marketing year (4.734 billion bushels).
U.S. Soybean Use
On the demand side, 2018/19 U.S. soybean crush is forecast at 2.080 billion bushels up by 10 million bushels from the October projection and up 25 million bushels from the previous year estimate.
2018/19 U.S. soybean exports are projected down 160 million bushels (8 percent) to 1.9 billion bushels compared with last month (2.060 billion bushels). The new export projection is down 10.8 percent relative to the 2017/18 marketing year estimate (see Figure 1). The export forecast was reduced based on the substantial decline in shipments and outstanding sales to China, the traditional largest importer of U.S. soybeans. Retaliatory tariffs imposed by China on U.S. beans have reduced exports this marketing year.
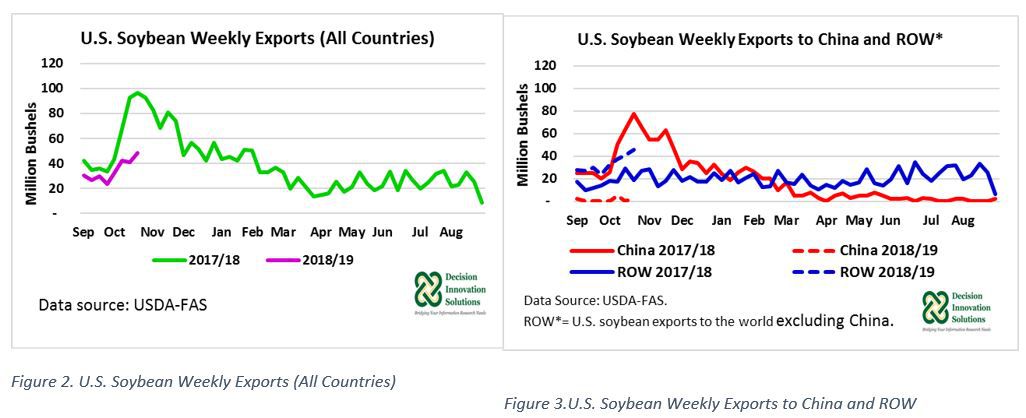
Figure 2 shows the overall pace of U.S. soybean weekly shipments as of October 25, 2018, compared with the last marketing year. Weekly exports to all destinations during the eighth week (October 25, 2018) of the current marketing year reached a volume of 48 million bushels compared with 96 million bushels during the same period last marketing year. U.S. soybean weekly exports to China during the eighth week of the current marketing year fell 97 percent to 3 million bushels from the same period last marketing year (77 million bushels). Weekly exports to other markets however have increased. On the week of October 25, 2018, shipments to other markets grew 45 percent to 46 million bushels year over year (see Figure 3). According to USDA, the pace of U.S. soybean exports to other markets is expected to continue throughout the rest of the marketing year, which typically increase during the second half of the year.
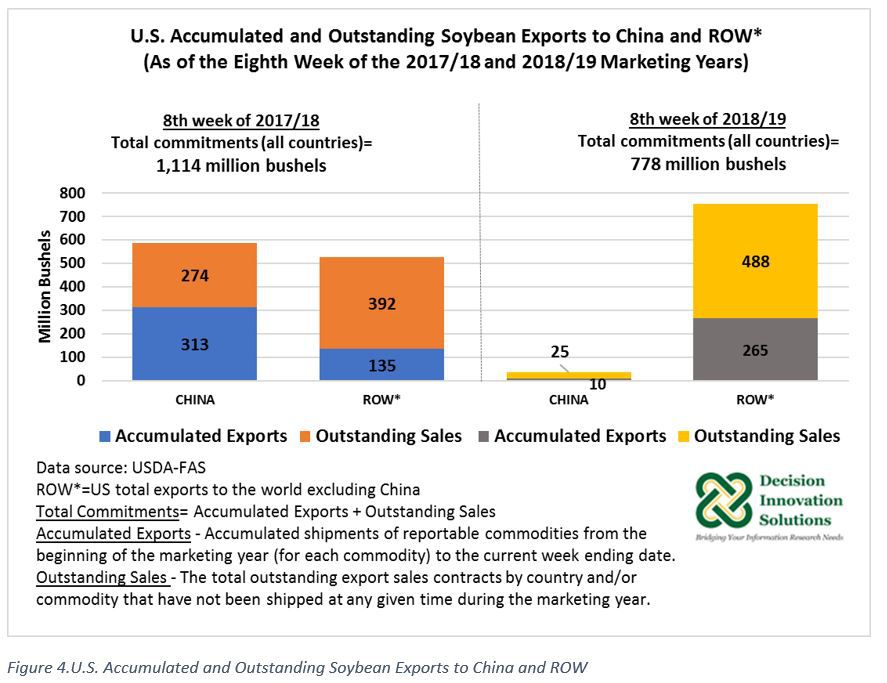
U.S. soybean accumulated exports and outstanding sales to China and other markets as of the eighth week of the 2017/18 and 2018/19 marketing years, are shown in Figure 4. U.S. soybean total commitments to China during the first eight weeks of the current marketing year were equal to 35 million bushels, which corresponded to 10 million bushels in accumulated exports and 25 million bushels in outstanding sales. In contrast, U.S. total commitments by the eighth week of 2017/18 reached a volume of 587 million bushels. That amount included 313 million bushels in accumulated sales and 274 in outstanding sales. With competitive U.S. soybean prices, total commitments to other countries have increased from 527 million bushels during the first eight weeks of 2017/18 to 753 million bushels during the same period of the current marketing year.
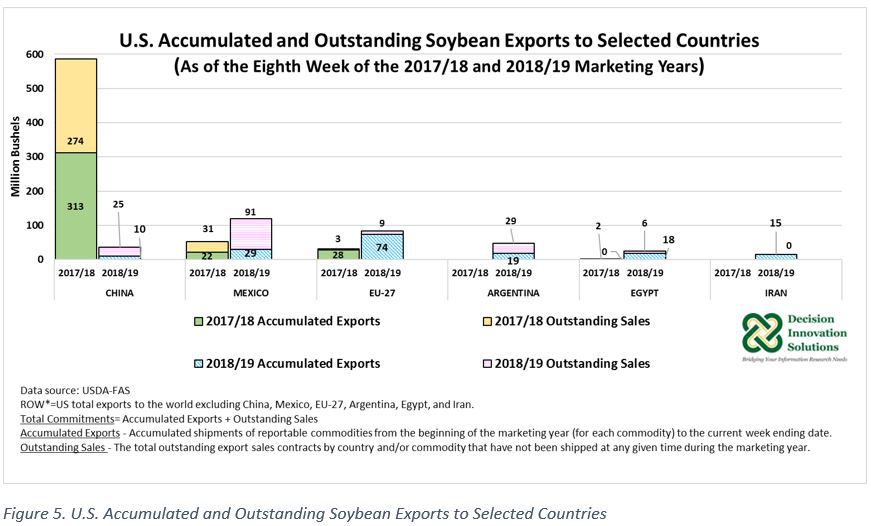
Because of the substantial drop in accumulated exports and outstanding sales to China, total U.S. soybean total commitments (to all countries, including China) were equal to 778 million bushels compared with 1,114 million bushels during the eighth week of last marketing year. This represents a 29 percent decline in total commitments so far this marketing year compared with the first eight weeks of the 2017/18 marketing year (see Figure 4). As of October 25, 2018, the main export destinations for U.S. soybean beans are Mexico, the European Union, Argentina, Egypt, and Iran (see Figure 5).
U.S. Soybean Export Prices
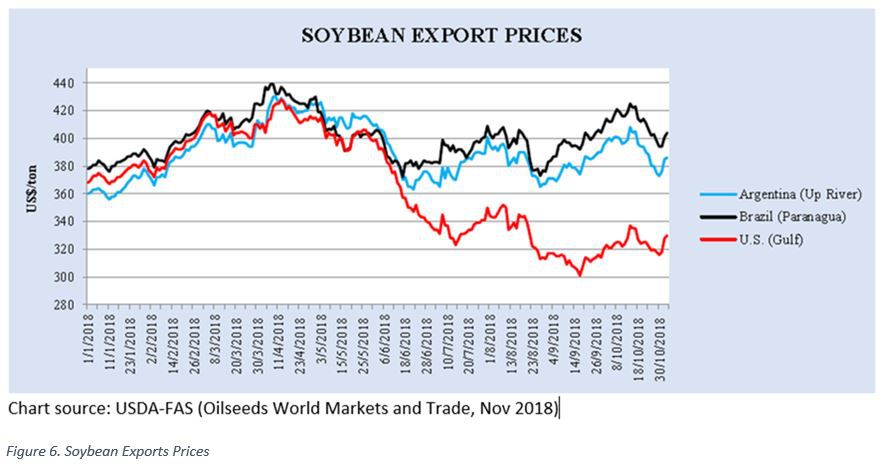
U.S. soybean export prices have been declining since June 2018 (see Figure 6), reflecting in part the current tariffs imposed by China on U.S. soybeans. As reported by USDA-FAS, U.S. soybean export bids in October 2018, FOB Gulf, averaged $325 per ton, increasing $13 from September. In contrast, FOB Brazil Paranagua averaged $414 per ton, while FOB Argentina Up River averaged $395 per ton. Average prices for Brazil and Argentina both increased from the previous month (up $17 for Brazil and up $15 for Argentina).
The U.S. average soybean price in October 2018 was down $51 per ton compared with October 2017 ($376 per ton), while October 2018 average prices for Brazil and Argentina were up $28 per ton and $17 per ton, respectively compared with the same period a year ago.
2018/19 Projected U.S. Soybean Ending Stocks and Price
Despite the increase in the 2018/19 soybean crush projection, the substantial expected large reduction in U.S. soybean exports resulted in an enlarged ending stock forecast. In the latest projection, 2018/19 ending stocks are up 8 percent to 955 million bushels from the October projection. If realized, ending stocks would double the estimate for the 2017/18 marketing year (438 million bushels). The U.S. season-average farm soybean price range is forecast at $7.60 to $9.60 per bushel, unchanged at the midpoint from the previous month’s projection ($8.60 per bushel). The November U.S. price projection is down $0.73 per bushel compared with the 2017/18 estimate ($9.33).
Want more news on this topic? Farm Bureau members may subscribe for a free email news service, featuring the farm and rural topics that interest them most!