Tight Supplies Caused Unusual Basis Levels in 2021 and 2022
Author
Published
9/8/2022
After consecutive years of high production, the U.S. had a large residual supply of both corn and soybeans from 2014 to 2020. However, a combination of lower production and relatively strong use moved the supply of corn and soybeans lower in the 2020/21 and 2022/23 marketing years. The decreases in supplies are evident in the ending stocks of corn and soybeans (Figure 1 and Figure 2).
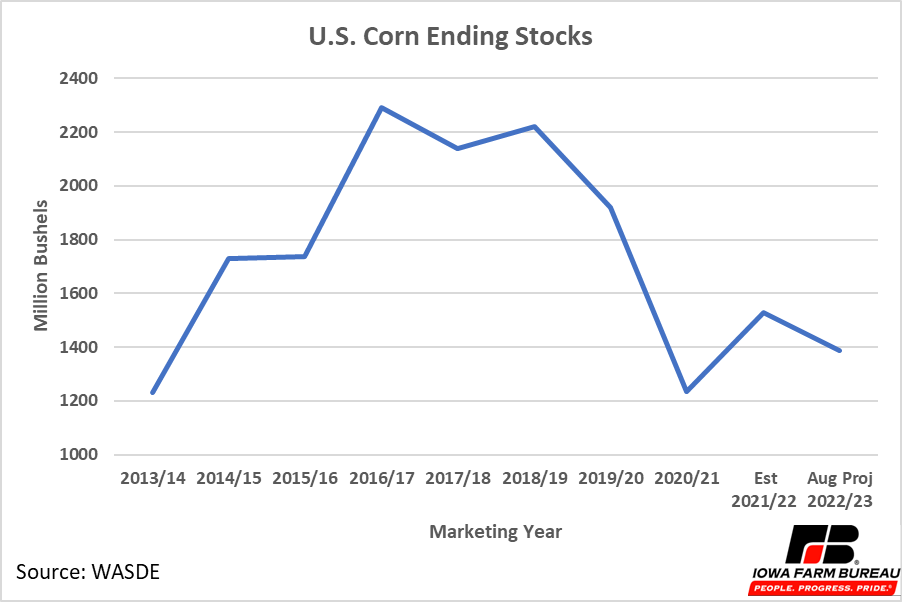
Figure 1. U.S. Corn Ending Stocks
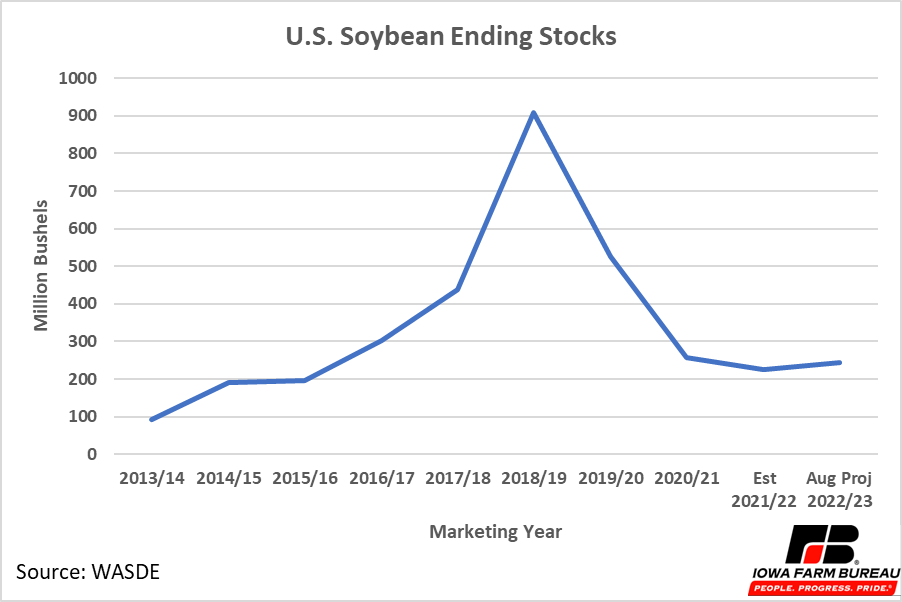
Figure 2. U.S. Soybean Ending Stocks
The relatively lower supply of both corn and soybeans affected the basis in recent years. Basis is equal to the cash price minus the futures price. The basis exists to cover differences in transportation costs, storage costs, local supply and demand, and other factors that vary across the U.S. Basis can also reflect the difference between domestic, local demand and world (export) demand. The basis typically declines (becomes more negative) heading into harvest season and reaches highs in the summer months, when stocks in storage are at their lowest and before the next harvest season begins, but overall remains relatively consistent. Figure 3 and Figure 4 compare Iowa average corn and soybean cash prices to the continuous futures prices. The corn continuous futures contract does not include September as a reference month, so the reference month skips from July to December. Similarly, the soybean continuous futures contract jumps from the July contract to November contract for the reference month, skipping the August and September contracts. This helps eliminate some shifts in the futures contract and basis that occur only due to changes in the reference contract month.
Looking at Figures 3 and 4, prior to 2021, the cash price followed the futures price consistently throughout the year. At the end of the summer in July and August, cash prices generally moved with December corn and November soybeans. The basis was slightly higher (more positive) during the summer months, but large spikes and drops in the basis were not present. However, things changed in 2021. When the corn reference month changed from July to December, low supplies kept cash prices elevated well above December corn prices for a significant period. Soybeans followed a similar pattern when the reference month switched from July to November. Low supplies kept cash prices elevated longer through the summer in 2021 and 2022, up to the very start of the next harvest season, in contrast to previous years when the cash price followed the new crop contract. Nevertheless, last year the harvest season eventually brought cash prices and basis to typical levels, and this has begun to occur now in 2022 as well.
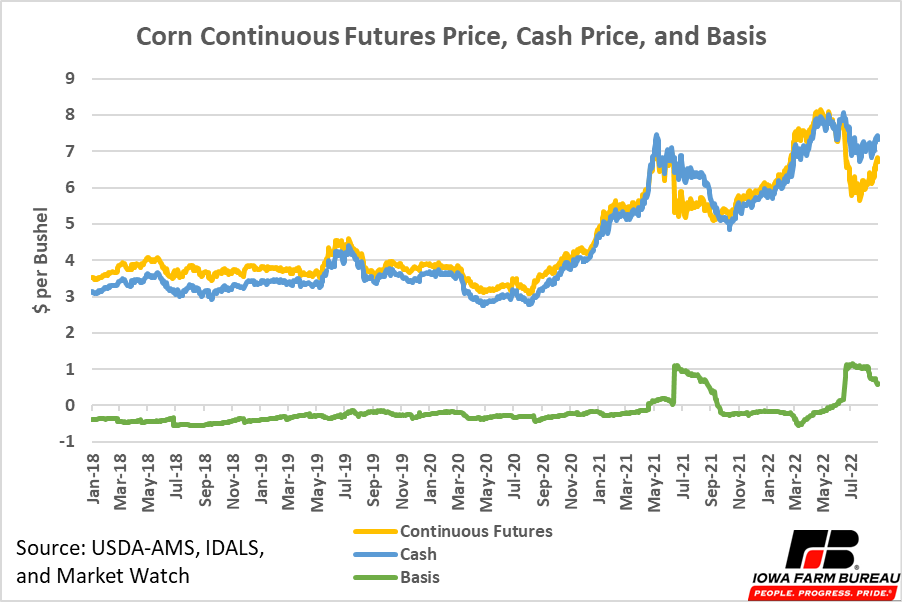
Figure 3. Corn Continuous Futures Price, Cash Price, and Basis
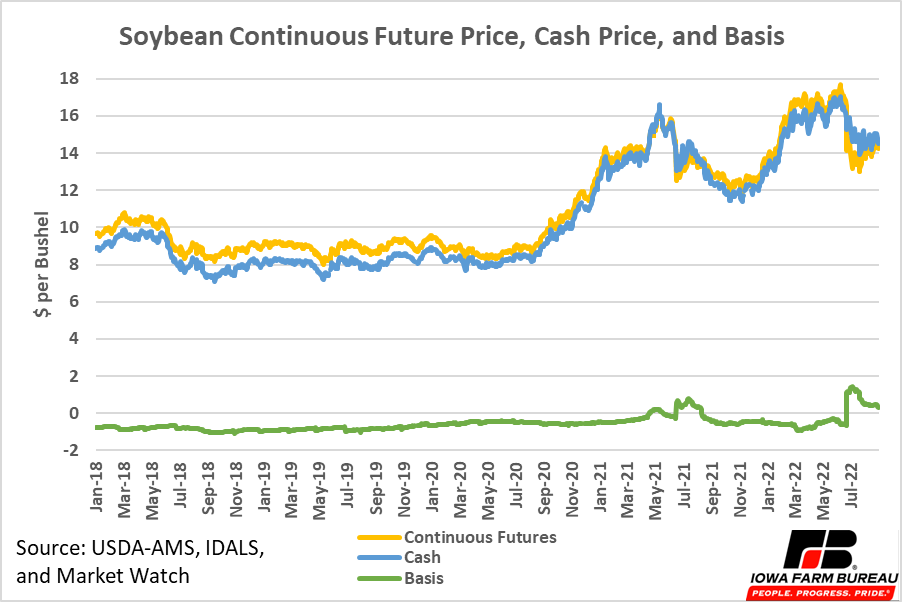
Figure 4. Soybean Continuous Futures Price, Cash Price, and Basis
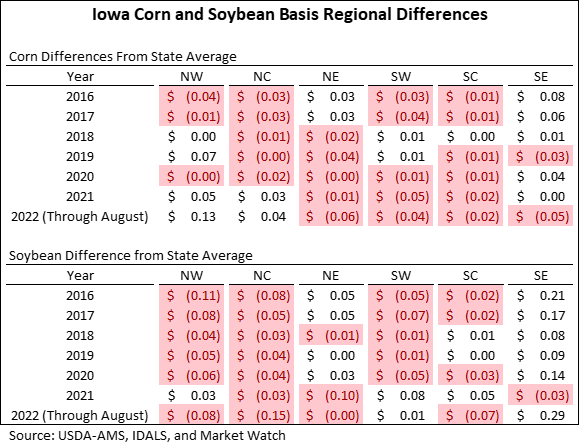
While supply and demand caused unique basis levels to occur relative to prior years, basis levels across the state stayed consistent relative to each other. Location also plays a major part in the determination of the basis, and as a result, the price received by farmers. Areas near end users of commodities are more likely to have a more favorable basis as the transportation cost to the end user is typically lower. End users are those who do not intend to resell the commodity, like ethanol plants, soybean crush plants, feed mills, or livestock producers. The USDA-AMS reports aggregated data for six commodity price reporting districts in the state (Figure 5). The average difference from the state average in each of the six districts is shown in Table 1. Average basis levels below the state average are highlighted in red. While there is some variability in the regional basis each year, certain relationships tend to hold over time. For example, generally there are not large differences in the basis of corn between the six regions. Though northwest Iowa did have a move favorable basis level in the last two years. Soybean basis levels have been strongest in southeast Iowa in recent years, and this was especially obvious last year, when the regional basis was much higher than any other region.
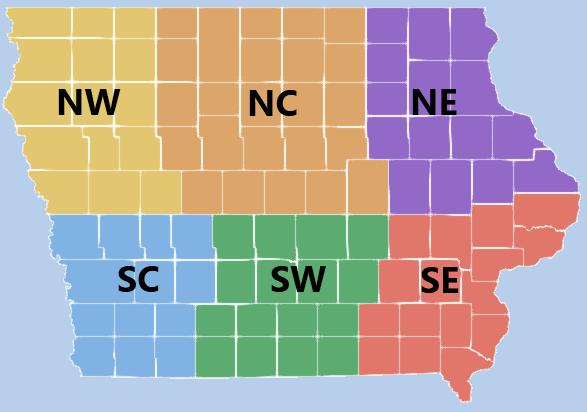
Figure 5. Map of Iowa Commodity Price Reporting Regions
Table 1. Iowa Corn & Soybean Basis Regional Differences from State Average
Many factors effect basis levels including supply and demand and location. Over the past two years relatively low projected ending stocks have kept cash prices and the basis higher than in years past, especially near the beginning of the harvest season. Regional basis levels have not experienced drastic changes in recent years, outside of typical year-to-year variability.
Economic analysis provided by Aaron Gerdts, Research Analyst, Decision Innovation Solutions on behalf of Iowa Farm Bureau.
Want more news on this topic? Farm Bureau members may subscribe for a free email news service, featuring the farm and rural topics that interest them most!