Outlook for U.S. Farm Income Mildly Optimistic for the 2017 Calendar Year
Author
Published
9/26/2017
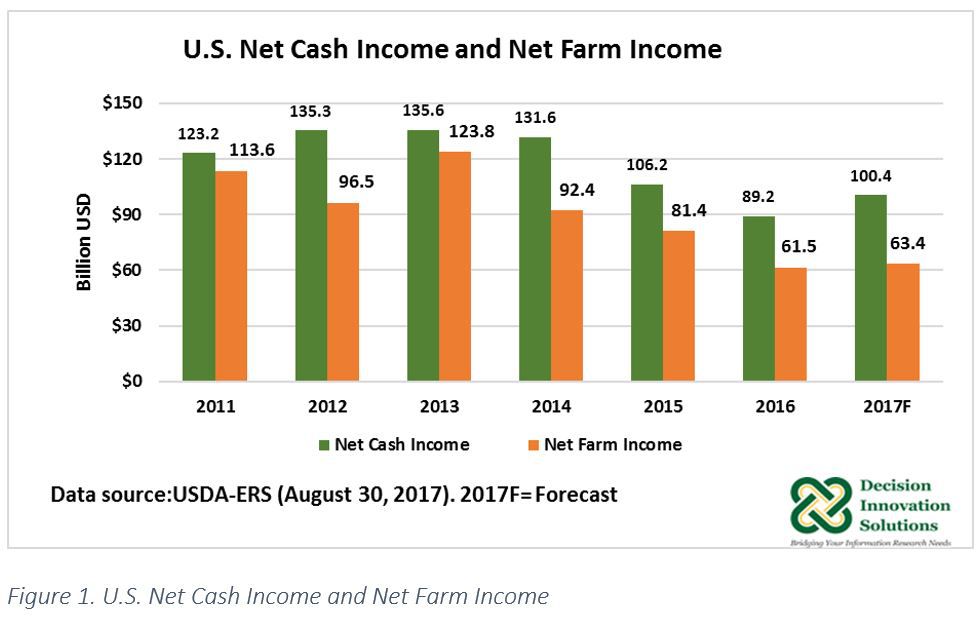
The latest (August 30, 2017) and second USDA forecasts for the 2017 calendar year for U.S. net cash income (gross cash income[1] minus cash expenses) and U.S. net farm income (total gross income[2] minus total expenses), indicate an increase for both measures compared with 2016 estimates. Net cash income is forecast up 12.6 percent to $100.4 billion year over year, whereas net farm income is expected to grow by $1.9 billion (3.1 percent) to $63.4 billion compared with last 2016’s estimate ($61.5 billion).
Compared with the first forecast early this year (February), net cash income is up 7.3 percent with expected higher animals and products cash receipts. A slight (0.2 percent) increase in cash expenses is also projected for crop cash receipts. The August forecast for net farm income is 1.7 percent higher than the forecast in February ($62.3 billion). As Figure 1 shows, despite the latest 2017 U.S. net cash income and 2017 U.S. net farm income upward trend forecasts, they are both down 26.0 percent and 48.8 percent, respectively, from their corresponding record high estimates in 2013.
2017 Projections for U.S. Agricultural Cash Receipts
Total cash receipts are forecast up 4 percent ($14.1 billion) to $366.6 billion during 2017 compared with last year ($352.4 billion). Based on expected higher prices for most animals and animal products and larger quantities sold of these commodities, cash receipts from animals and products are expected to be the largest contributor to the increase in 2017 total cash receipts. Animals and products cash receipts are forecast to grow $13.6 billion to $176.5 billion year over year (see Figure 2) and would make up 48.1 percent of total cash receipts. Cattle and calf cash receipts are forecast up 5.7 percent to $67.6 billion. If the forecast holds for 2017, cattle and calf cash receipts would make up 18.4 percent of total cash receipts, and would be the largest component of animals and animal products cash receipts with a 38.3 percent share. At the national level, 2017 hog cash receipts are forecast to increase 14.6% to $21.6 billion year over year. 2017 hog cash receipts would make up 6.0 percent of expected 2017 total cash receipts and 12.2 percent of 2017 animals and products cash receipts. Both poultry and eggs cash receipts and dairy products- milk cash receipts are forecast up 8.4 percent to $41.9 billion and 11.1 percent to $38.4 billion, respectively, compared with 2016.
Relative to 2016, cash receipts from crops are expected to slightly rise by $0.5 billion to $190.1 billion in 2017 and would make up 51.9 percent of total cash receipts (see Figure 2). Based on expected lower corn prices and higher soybean prices, 2017 calendar year corn cash receipts would decline 0.7 percent to $45.7 billion, whereas 2017 calendar year soybean cash receipts are forecast to rise 6.3 percent to $40.4 billion year over year. Corn and soybean cash receipts are expected to make up 24 percent and 21 percent of total crop cash receipts, respectively, in 2017. Cash receipts from these two crops combined are forecast to represent almost a quarter (23.5 percent) of total cash receipts from all commodities.
2017 ARC, PLC, and Conservation Program Payments
2017 government farm program payments are expected to decline 0.2 percent to $12.96 billion in 2017 compared with 2016 ($12.98 billion). Price Loss Coverage (PLC, a price-based program) and Conservation programs are the only programs expected to increase 80.2 percent to $3.5 billion and 6 percent to $3.99 billion, respectively, compared with 2016. According to USDA, overall, the PLC payment rate for corn is expected to increase from $0.09/bushel in 2016 to $0.34/bushel in 2017. Agricultural Risk Coverage (ARC, a revenue-based program) and the Biomass Crop Assistance Program (BCAP) are forecast at $4.9 billion and $3.0 million, correspondingly, in 2017. Compared with 2016, ARC would decline 19.2 percent while BCAP is expected to fall 56.4 percent.
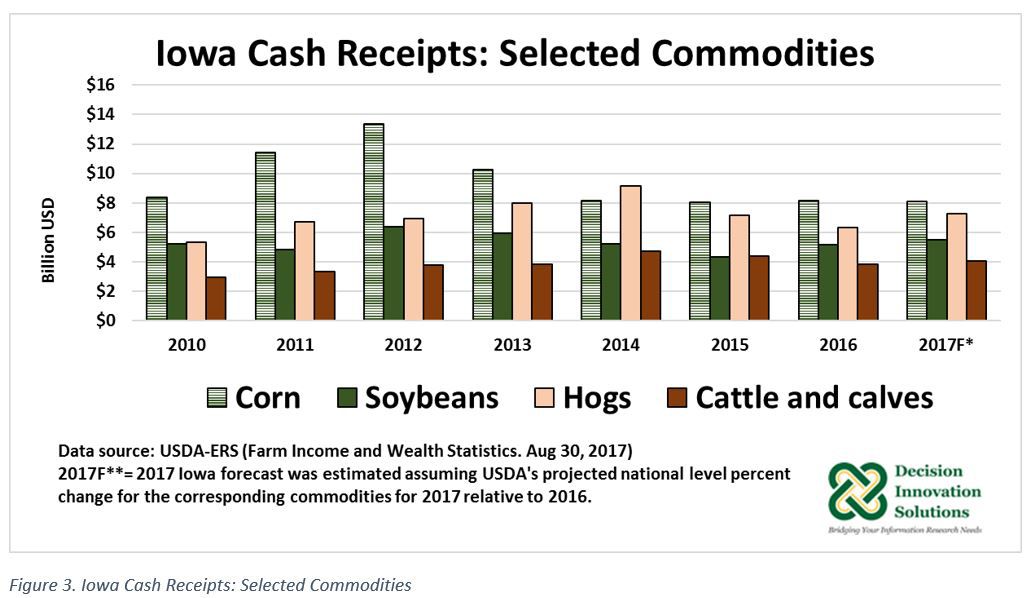
Iowa’s 2017 Agricultural Cash Receipts Outlook: Hogs, Cattle, Corn, and Soybeans
USDA-ERS cash receipt state data are available through 2016. Iowa’s cash receipts for corn, soybeans, hogs, and cattle and calves for 2017 were estimated assuming the USDA's forecast national level percent changes for the corresponding commodities for 2017 relative to 2016.
Based on this assumption, the resulting estimates shown in Figure 3 indicates that during calendar year 2017, Iowa’s corn cash receipts would decrease by $53.7 million to $8.08 billion from $8.13 billion in the 2016 calendar year. Soybean cash receipts would increase by $0.33 billion, from $5.18 billion in the 2016 calendar year to $5.51 billion in the 2017 calendar year. Iowa’s cash receipts for hogs would increase to $7.28 billion in 2016 compared with $6.35 billion in 2016, and cattle and calves would rise to $4.08 billion from the estimate for 2016 ($3.86 billion).
It is important to mention that 2017 Iowa cash receipts presented here may change as 2016 estimates may be revised a year from now when USDA revises previous years’ estimates. Also, 2017 Iowa cash receipts are subject to changes based on USDA’s final release (November 2017) of the 2017 U.S.-level calendar forecast.
2017 Projections for U.S. Agricultural Expenses
As Figure 4 indicates, 2017 U.S. total agricultural expenses are forecast at $355.1 billion, up 1.3 percent from the 2016 estimate ($350.5 billion). Hired labor ($29.5 billion), interest expenses ($19.6 billion) and fuel and oil ($13.5 billion) are among the agricultural expenses forecast to increase in 2017 calendar year relative to previous year estimates. Hired labor is expected to increase 5.7 percent, while interest expenses and fuel and oils are forecast to rise 12.8 percent and 10.8 percent, respectively. On the other hand, feed, seed, and fertilizer, lime, and soil conditioner are all forecast to fall in 2017. Feed is forecast at $54.0 billion and expected to decline 2.9 percent from the 2016 estimate ($55.6 billion) (see Figure 4). According to the forecast, seed ($21.6 billion) and fertilizer, lime, and soil conditioner ($21.2 billion) will drop 1.2 percent and 9.9 percent, respectively, compared with the 2016 calendar year.

2017 Projections for U.S. Farm Assets
U.S. farm real estate assets are expected to increase 4.6 percent to $2,557 billion in 2017 compared with the 2016 estimate ($2,443 billion). The forecast indicates real estate farm assets would make up 83.2 percent of 2017 total farm sector assets which are expected to grow 4.0 percent to $3,074.9 billion year over year. Sixty two percent ($242.4 billion) of 2017 total farm debt ($390 billion) is expected to be from 2017 farm real estate debt. Both measures are forecast to grow in 2017. Compared with their corresponding 2016 estimates, 2017 total farm debt would increase 4.4 percent and 2017 farm real estate debt would rise 7.5 percent. 2017 Farm equity (total farm assets minus total farm debt) is forecast to grow 3.9 percent to $2,684.9 billion in 2017 from the 2016 estimate ($2,583.1 billion).
The debt-to-asset ratio and debt-to-equity ratio, which are farm solvency measures, are forecast at 12.68 percent and 14.52 percent, both measures are forecast to increase marginally by 0.4 percent and 0.5 percent, respectively, from the corresponding last year estimates. Although these measurements are historically low, they have been deteriorating since 2014.
2017 Prices of Selected Livestock and Crop Commodities
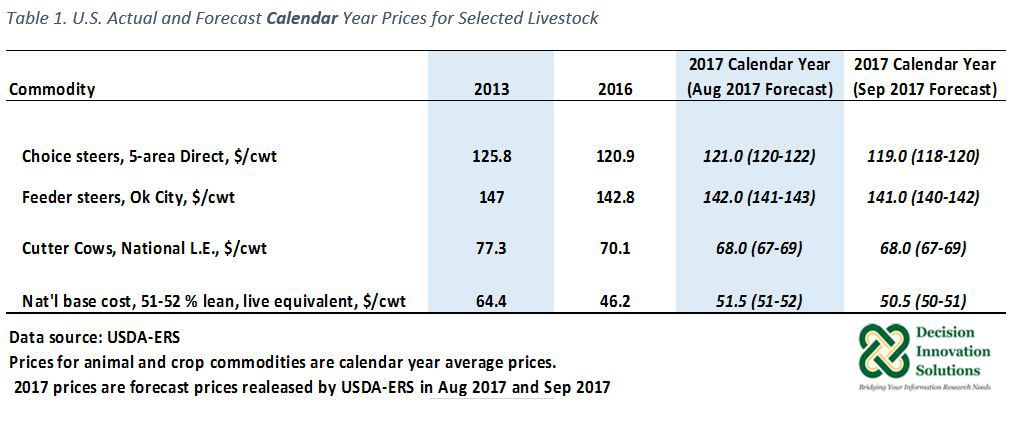
In August 2017, USDA indicated most animals and animal product prices were expected to increase in the 2017 calendar year, while overall crop prices were expected to decline during the same time. In addition, USDA indicated quantities sold were forecast to increase for both crops and livestock. If the farm income forecast for 2017 calendar year released in August 2017 is realized, it would be the first year net farm income has increased since it reached a record high in 2013, which was when commodity prices for both livestock and crops were higher when compared with expected 2017 prices. Cash receipts from animals and products are expected to support the increase in 2017 total cash receipts. However, as Table 1 indicates, USDA 2017 projected prices for some livestock commodities have declined from the August 2017 projection to this month’s price projections. For example, prices for 5-area fed and feeder steers, were projected lower in September than previous month’s projections (see Table1). 2017 projections for these two commodities, as well as for cutter cows, are now lower than 2016 price estimates for these commodities. Larger beef supplies this year may compensate for the September 2017 lower prices projections for these commodities in 2017, and may still contribute to push up 2017 animal cash receipts compared with last year. As reported by USDA in its September 2017 edition of the Livestock Dairy Poultry Outlook report, fed steer prices may be pressured in the short-term in response to the large supplies of cattle available to be marketed in the fourth quarter of 2017. This is also due to ample supply of competing meats available.
In the case of live equivalent 51-52 percent lean hog price projections, USDA reduced the 2017 average price projection from $51.50/cwt in August to $50.50/cwt in September 2017 (see Table 1); however, 2017 prices remained higher than a year ago, indicating solid domestic and foreign demand this year.
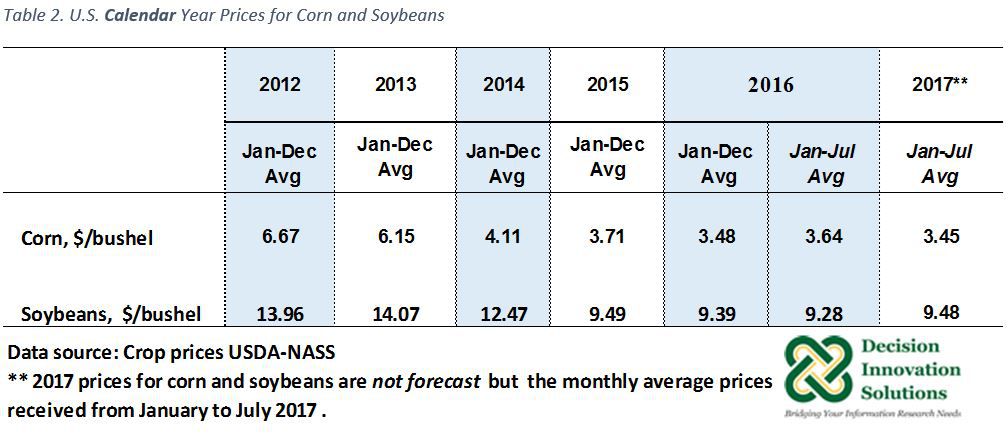
January to July 2017 corn monthly data indicates that average corn prices for the first seven months of 2017 were $0.19/bushel lower compared with the same period last year (see Table 2). Overall, 2017 calendar-year corn prices are expected to weaken for the fifth consecutive year, and despite the expected increase in quantity sold in the 2017 calendar year, corn receipts are forecast to decline this year. Soybean prices are expected to increase during the 2017 calendar year. On average, 2017 January to July soybean prices were up $0.21/bushel compared with the same period in 2016 (see Table 2). With expected higher prices and quantities of soybean sold in the 2017 calendar year, higher soybean receipts are forecast this year.
Despite the projected increase in 2017 net farm income compared with 2016, if realized, 2017 net farm income ($100.4 billion) would remain 48.8 percent below the record high net farm income registered in 2013 ($123.8 billion). The next USDA’s farm income forecast for 2017 calendar year will be released in November 2017.
[1] Gross cash income = cash receipts + federal government direct farm program payments + cash farm-related income
[2] Total gross income = gross cash income +nonmoney income + value of inventory adjustment
Want more news on this topic? Farm Bureau members may subscribe for a free email news service, featuring the farm and rural topics that interest them most!