Low Mississippi River Levels Creating Unusual Basis Situation
Author
Published
10/25/2022
Persistent drought conditions across the U.S. have caused Mississippi River water levels to decrease. Figure 1 and Figure 2 show the average weekly water level of the Mississippi at Dubuque, IA and Memphis, TN. These two locations are examples from the Upper Mississippi and the Lower Mississippi. At both locations, water levels sit well below average, especially for this time of the year. The river has faced these challenges before. Water levels in1980, 1988, and 2012 were like the levels being seen in 2022. One difference between now and prior dry years, however, is the extent of the low water levels across the Mississippi River system as well as in the major channels that feed the Mississippi River, including the Missouri River and the Ohio River. On October 22, 2022, the Mississippi River gauge at Memphis, Tennessee dipped to a new record-low water level of -10.81 feet. The previous record low was -10.70 feet set on July 10, 1988.
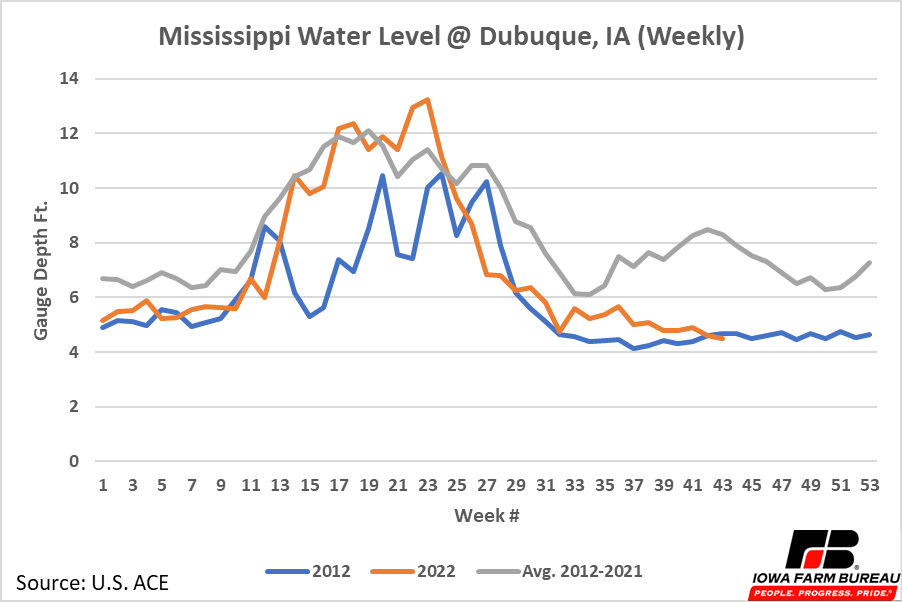
Figure 1. Mississippi Water Level @ Dubuque, IA (Weekly)
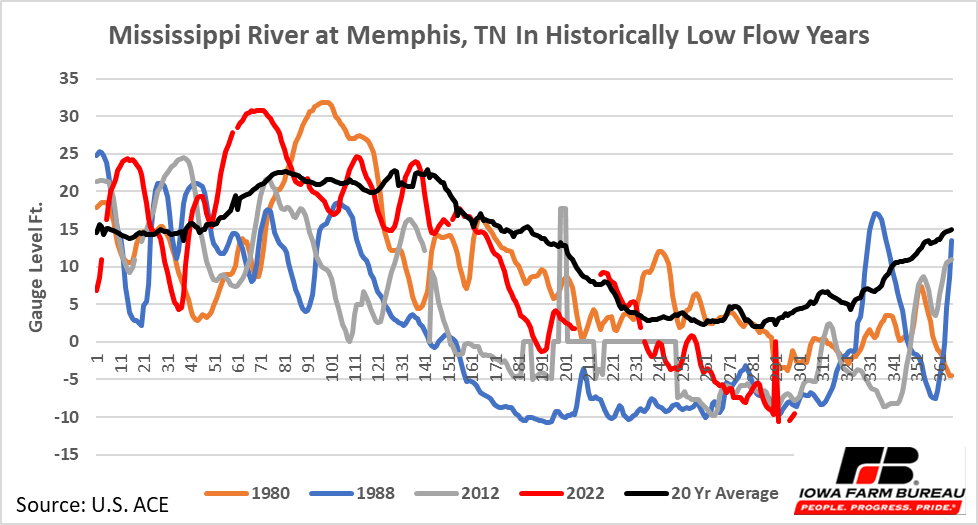
Figure 2. Mississippi Water Level at Memphis, TN (daily) in Historically Low Flow Years
Barge Rates and Shipments
The low water levels have made it difficult to ship grain down the river. The river becomes shallower and narrower meaning barges cannot be filled as full as normal and fewer barges can move down the river at the same time. In fact, according to industry sources, lowering the draft -- the distance between the top of the water and the bottom of the barge by 1 ft -- reduces the carrying capacity of the barge by about 8,000 bushels of corn. At full draft a barge can carry around 86,000 bushels of corn, so just a 1 ft reduction in draft reduces capacity by over 9%. Further reductions in draft really add up. If a barge only has 9 feet of draft (a reduction in draft of 28%), the load it can carry is reduced by 32% (Figure 3).
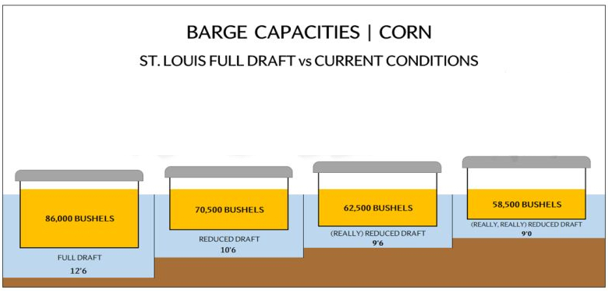
Figure 3. Barge Capacities
This has led to higher barge rates. Barge rates from four major regions along the Mississippi River are shown in Figure 4. Per ton rates recently peaked 3.5 to 8 times higher than 2021 average rates depending on the region. Last week rates came down some but remain 2 to 3 times higher than they were a year ago in all four major regions.
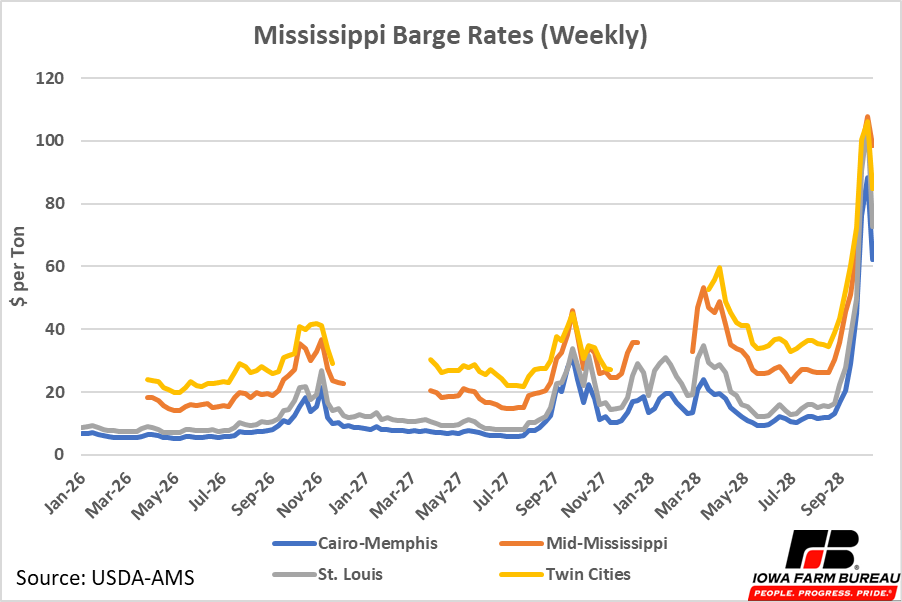
Figure 4. Mississippi Barge Rates (Weekly)
As barge rates have increased, shipments of grain down the Mississippi have slowed down. Figure 5 and Figure 6 show movement of corn and soybeans through the Mississippi Lock 27, which is a major lock near St. Louis, Illinois. Both commodities have seen reduced shipments through this lock, though soybean shipments have improved recently. The shipments of grains through other major locks on the Mississippi River have also been lower this year.
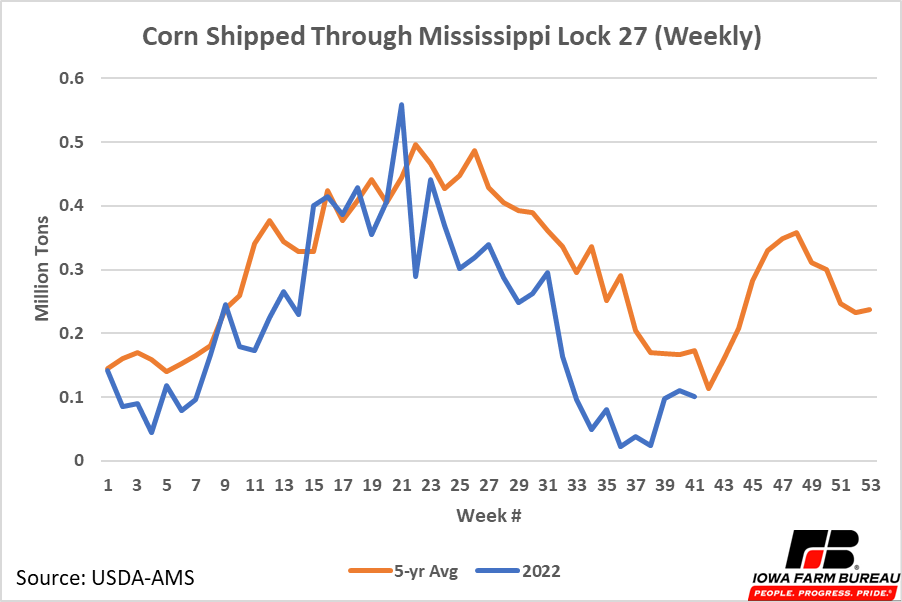
Figure 5. Corn Shipped Through Mississippi Lock 27 (Weekly)
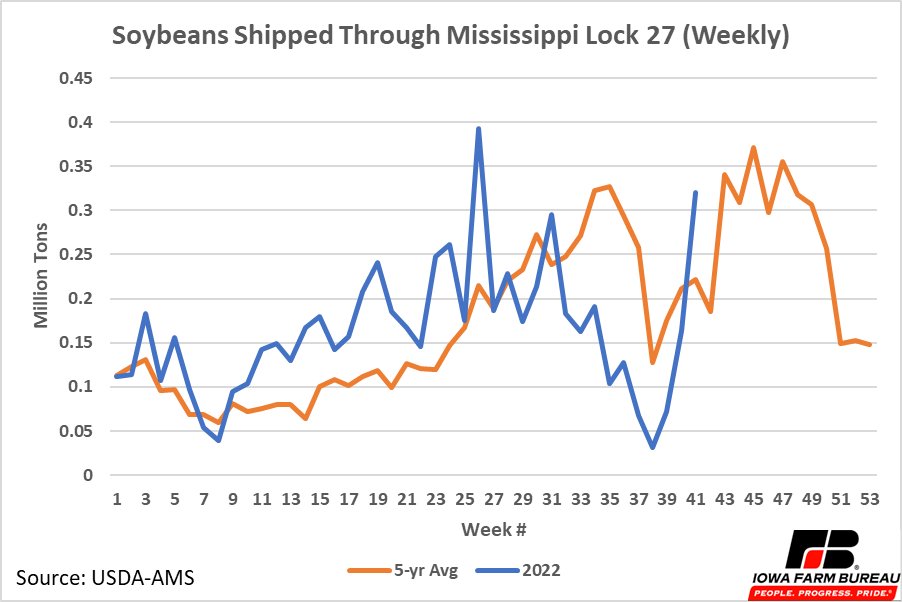
Figure 6. Soybeans Shipped Through Mississippi Lock 27 (Weekly)
Industry sources note the around 60% of U.S. grains and soybeans are exported through the U.S. Center Gulf near New Orleans. Of these exports, 95% arrive at the Gulf via the Mississippi River. In total, around 57% of U.S. grain and soybean exports move down the Mississippi. Low river levels will likely put additional pressure on the trucking and railroad industries to get product moved out of the U.S.
Basis Levels
High barge rates and reduced grain shipments mean excess grain is sitting next to the Mississippi River. This has led to unusual regional basis levels across the country. Typically, regions near the river have more favorable basis levels because barges are usually one of the cheaper forms of transportation. That has not been the case recently with extremely high barge rates.
Figure 7 and Figure 8 show recent corn and soybean basis levels estimates by Rabobank. Red and yellow levels are more positive while green and blue levels are more negative.
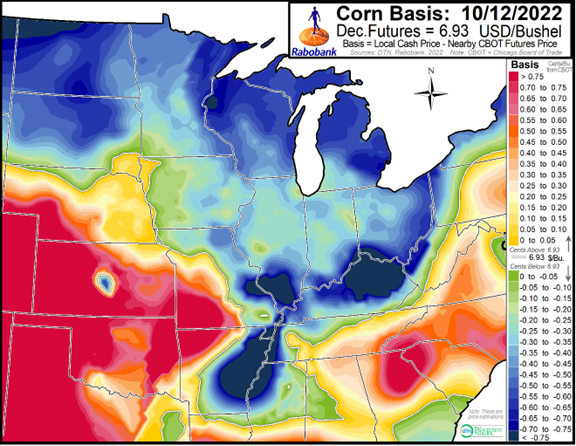
Figure 7. Rabobank Reported U.S. Corn Basis Levels
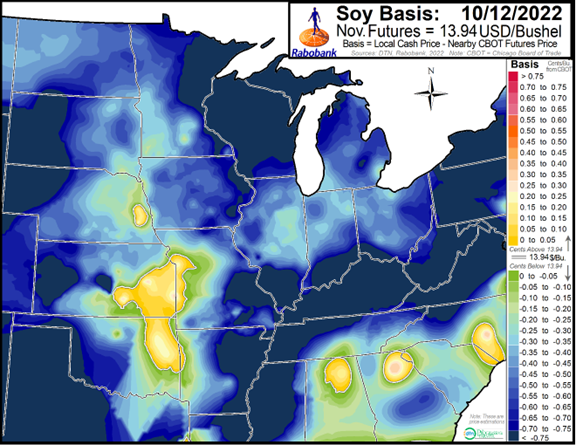
Figure 8. Rabobank Reported U.S. Corn Basis Levels
In the case of corn, Illinois, Missouri, and especially Arkansas have large negative basis levels in areas near the Mississippi that typically would have a more favorable basis. Kentucky which sends grain down the Ohio River and eventually into the Mississippi River also has a large negative basis. Meanwhile, Kansas, Nebraska, and other Great Plains states have extremely positive basis levels. These states suffered from drought, and their yields suffered. Most of these states also have relatively high livestock numbers, notably cattle. Feed is needed in these states which has led to favorable basis levels. In addition, rail lines from these areas can send corn and soybeans to export ports along the Texas Gulf Coast.
Soybeans have lower basis levels across the country. Still, like corn, regions along the Mississippi River, especially the lower Mississippi have lower basis levels than historically expected for this time of year. Also, like corn, the Great Plains and Southeast both have positive soybean basis levels. Shipping problems on the Mississippi River are creating opportunities in other regions of the country that can ship grain via rail lines to export facilities.
The low river levels have impacted basis levels in Iowa, especially the eastern portion of the state. Southeast Iowa is provided as an example of how basis levels have changed in the state due to the low water levels. Figure 9 and Figure 10 show the difference between the southeast Iowa basis and the state average basis level for corn and soybeans respectively.
The orange lines represent the average difference between the regional and state basis level from 2017 to 2021. In both graphs this line is typically above zero, meaning Southeast Iowa typically enjoys a more positive basis compared to other regions of the state, likely in part because it is close to the Mississippi River with cheap barge transportation available.
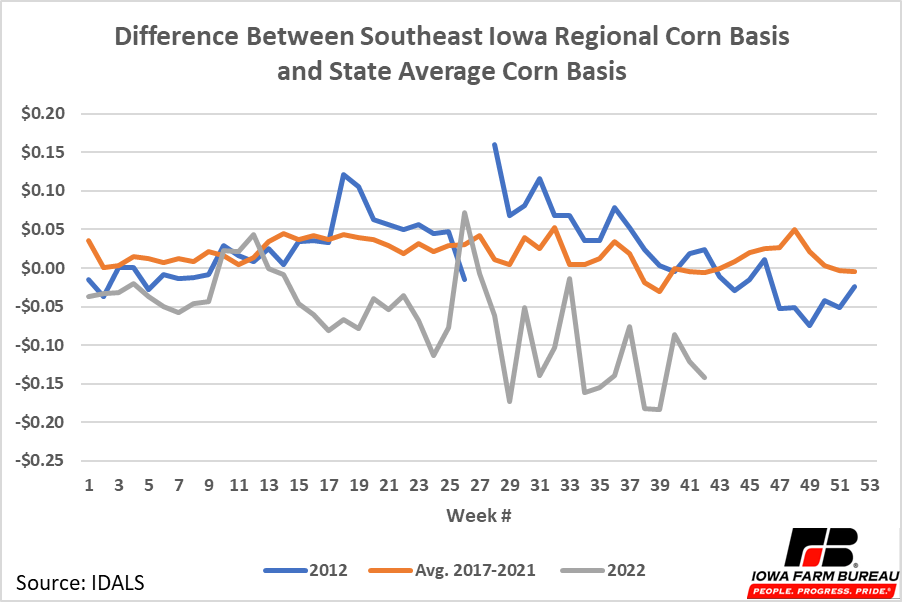
Figure 9. Difference between Southeast Iowa Regional Corn Basis and State Average Corn Basis
However, this year basis levels for corn have been less than the state average and have been moving lower. Some, if not all, of this downward movement is likely due to increased costs associated with increased barge rates.
The soybean basis in Southeast Iowa remained much stronger than the rest of the state until barge rates started moving higher. However, soybeans in southeast Iowa have also felt the effects of the low river over the last few weeks with basis levels moving well below the state average.
Also included in both graphs is the regional basis difference in 2012, a year which saw similar Mississippi River water levels. The regional basis for both corn and soybeans was also negatively affected in 2012. The corn basis in Southeast Iowa remained stronger longer in 2012 but eventually did move below the state average, though not to the extent it has in 2022. For soybeans, the southeast Iowa basis moved below the state average sooner in 2012 but did not fall as far as it has in 2022.
Both basis levels have been more negatively affected in 2022 compared to 2012.
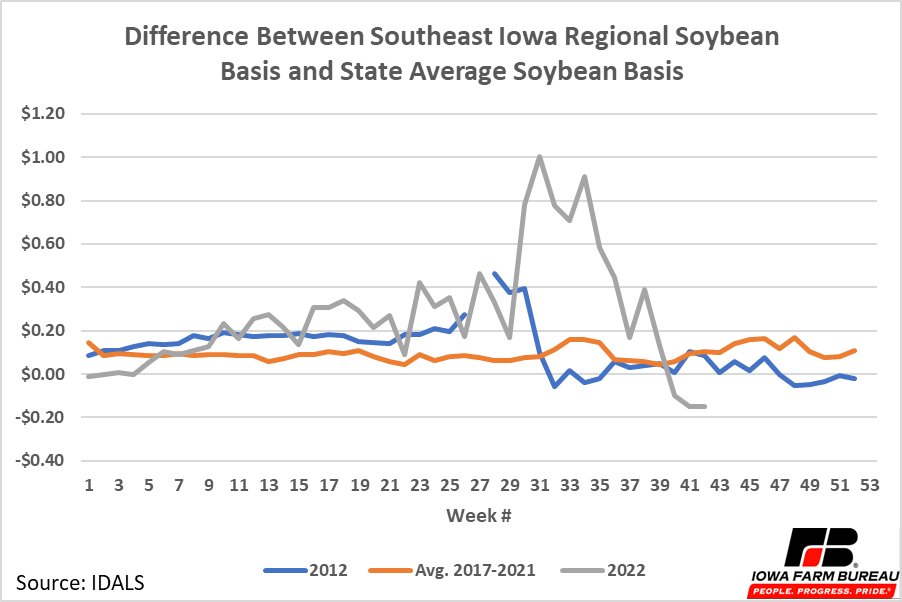
Figure 10. Difference between Southeast Iowa Regional Soybean Basis and State Average Soybean Basis
Final Thoughts and Outlook
The low waters in the Mississippi have increased the costs of transporting grain down the river. This has increased transportation costs across the country and negatively affected basis levels along the river, including in eastern Iowa. Across the country, basis levels are pushing grain away from the Mississippi. The inability to move grain out of the country could put additional negative pressure on prices if total export shipment expectations are not met.
Looking ahead conditions are not likely to improve. Figure 11 is a map of all the river tributaries that feed the Mississippi River.
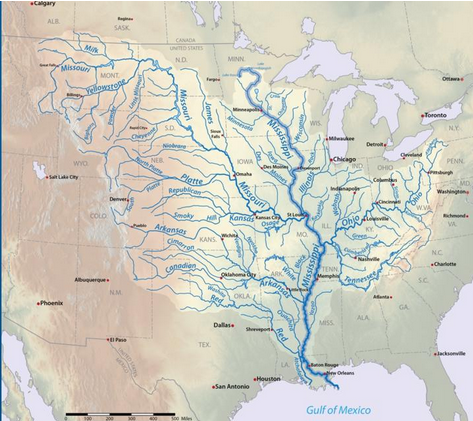
Figure 11. Map of all the Tributary Rivers That Feed Water into the Mississippi River
Both Upper Mississippi and Lower Mississippi river levels are suffering from lower river levels (Figure 12 and Figure 13). Since both regions are low, the options of sending more water down steam or holding more water back upstream are not options are this time. Seasonally, the Mississippi River at Memphis normally sees a 13-foot rise in river levels from the October low-flow to the end of the year. But, in years when the river level at Memphis ends the year with a negative river gauge reading, the average river gauge level at Memphis declines by 3.37 feet from October to the end of the year rather than rising 13 feet.
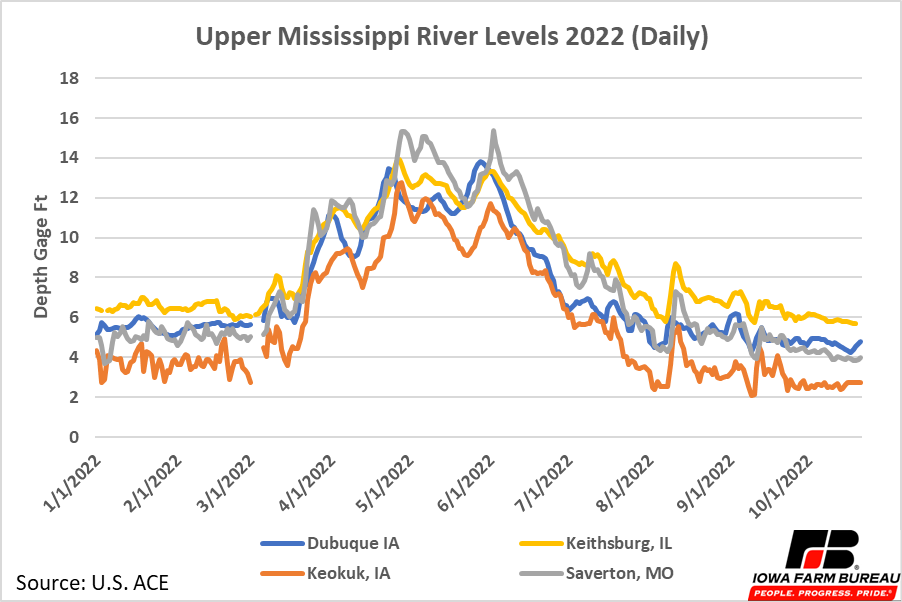
Figure 12. Upper Mississippi River Levels (Daily)
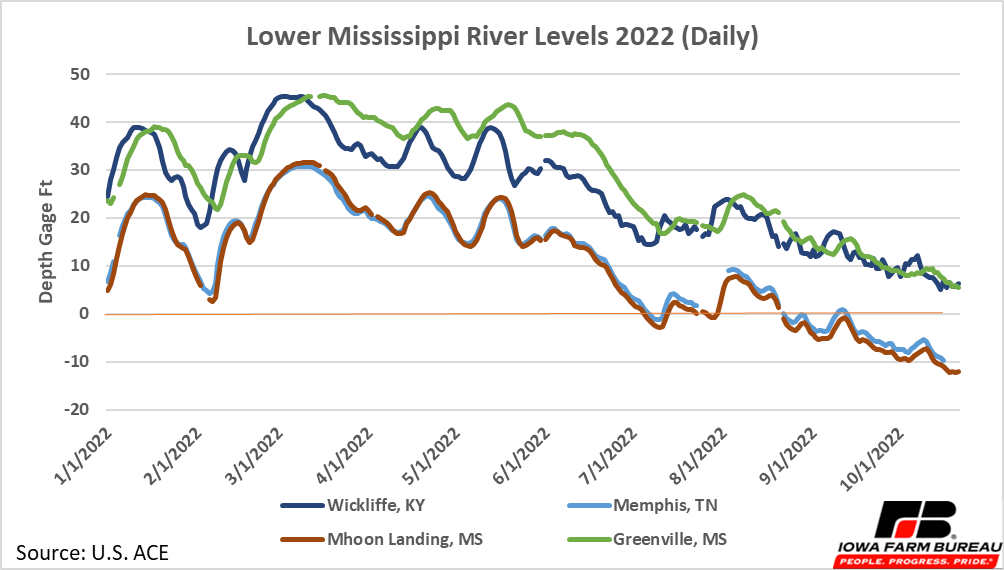
Figure 13. Upper Mississippi River Levels (Daily)
Furthermore, the National Weather Service is predicting drought to continue across most of the U.S. in the next three months (Figure 14). With no above-normal rains to replenish river levels expected in the next three months, it seems the problem could get worse before it gets better.
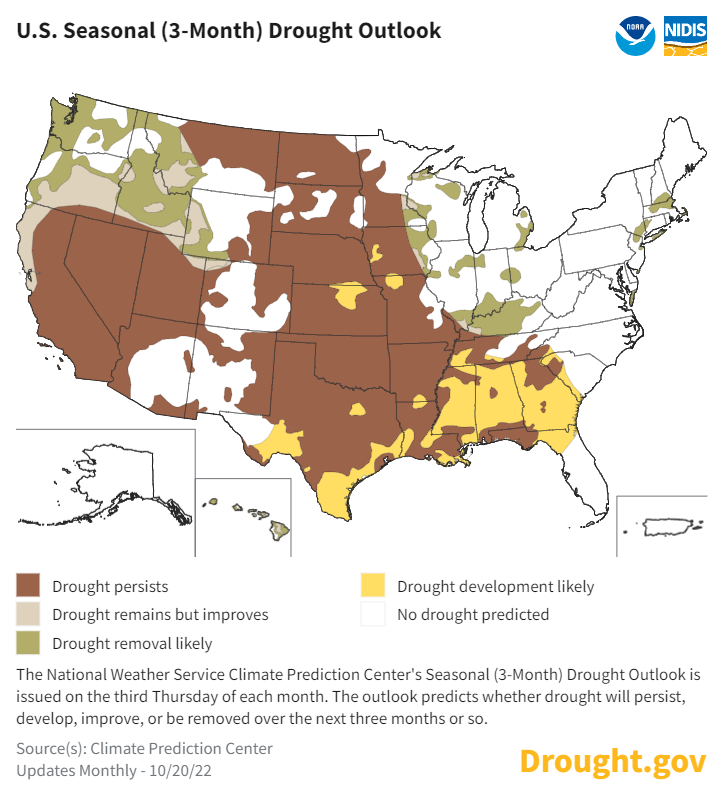
Figure 14. U.S. Seasonal (3-Month) Drought Outlook
Economic analysis provided by Aaron Gerdts, Research Analyst, Decision Innovation Solutions on behalf of Iowa Farm Bureau.
Want more news on this topic? Farm Bureau members may subscribe for a free email news service, featuring the farm and rural topics that interest them most!