World Soybean Trade
Author
Published
8/6/2026
Major Players
The dynamics of the global soybean market have been influenced by shifting production volumes, price volatility, and trade disruptions. The United States, despite remaining a major player in the global market, has shifted in terms of global production, exports, imports, and consumption relative to other major markets.
Brazil remains the top global soybean producer and export, accounting for 42% of global production and 62% of global exports. The United States follows as the second largest global producer and exporter accounting for 27% of global production and 23% of global exports. China maintains its place as the largest importer and consumer of soybeans. Notably, China accounts for 61% of global soybean imports and 31% of global consumption (Table 1).
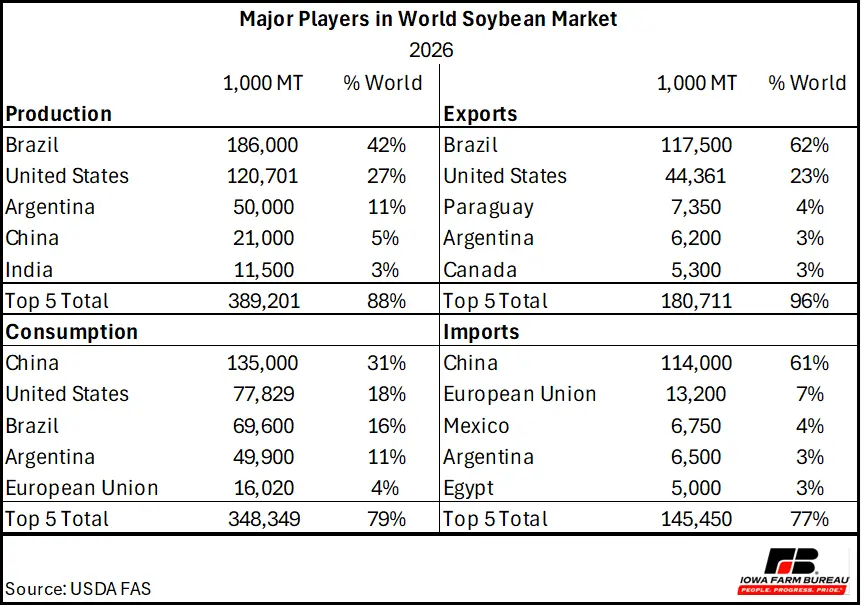
To gain a better understanding of the dynamics of the world soybean market and trade, the remainder of this article utilizes UN Comtrade data and is not comparable to the data from the USDA utilized in Table 1.
Relative Value of US Soybean Imports and Exports
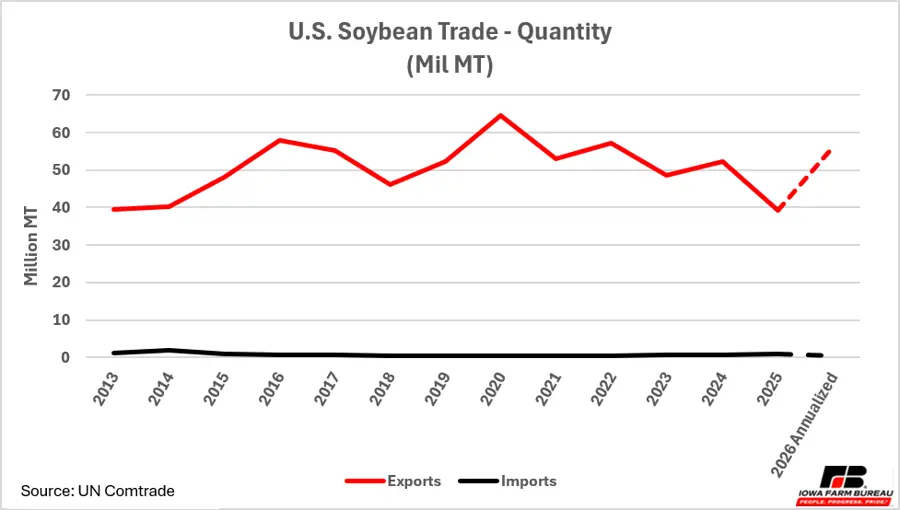
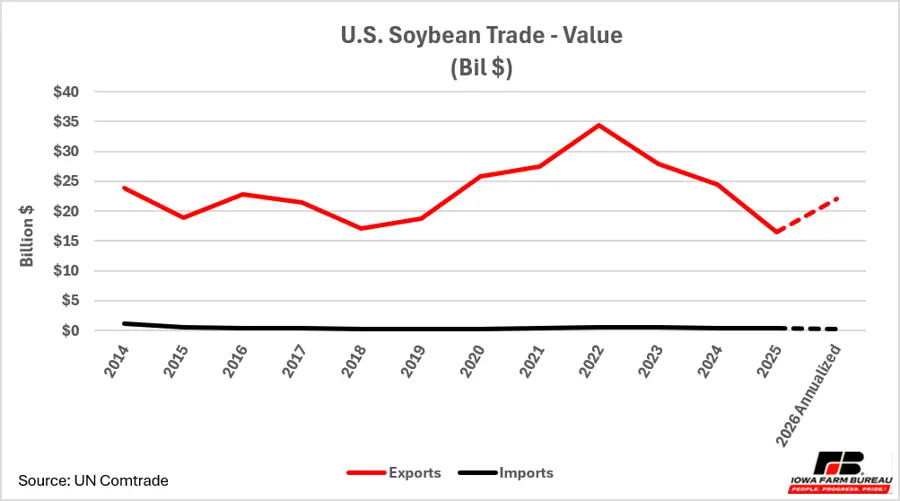
Figure 1 depicts U.S. soybean exports and imports in terms of quantity; Figure 2 illustrates U.S. soybean exports and imports by value; Figure 3 plots the average price per bushel of U.S. soybean exports and imports. Note that data for 2026 is only representative of the first three months of the year (January – March), so we can expect major changes to the data as we progress through the year into and following U.S. harvest. Since 2024, U.S. soybean exports have been declining whereas the value of U.S. soybean exports has been declining since 2022. However, annualized data from the first five months of 2026 based on the percentage of annual total for the first five months of 2025, 2026 annual soybean exports are estimated at 2.06 billion bushels valued at $21.96 billion. By volume, this would be 43% higher than 2025 total soybean exports and 8% higher than 2024. By value, annualized 2026 soybean exports would be 34% higher than 2025, but 10% lower than 2024.
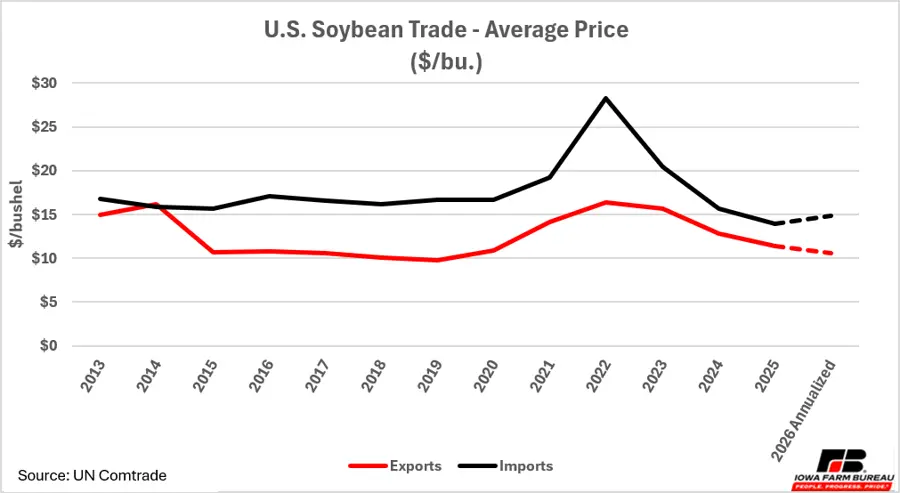
The average price of soybean imports are typically higher than the average price of soybean exports; however, the United States typically imports very little soybeans. The average price of soybean exports has fallen from $16.38/bushel in 2022 to $11.39/bu in 2025. The current data for 2026 (January through May) has the average price of soybean exports at $11.14/bu; however, annualized data for 2026 based on the first five months 2025 estimates average price soybean exports at $10.62/bu. This is considerably different from the average price of exports in 2014 at $16.18/bushel, which marked the first time in over a decade that the average price of exports was greater than the average price of imported soybeans.
Annualized 2026 data estimates minimal soybean imports, both by volume and value; however, average price of imports jump to $14.83/bu., up $0.55/bu. from 2025.
Major Trade Partners for US Soybeans
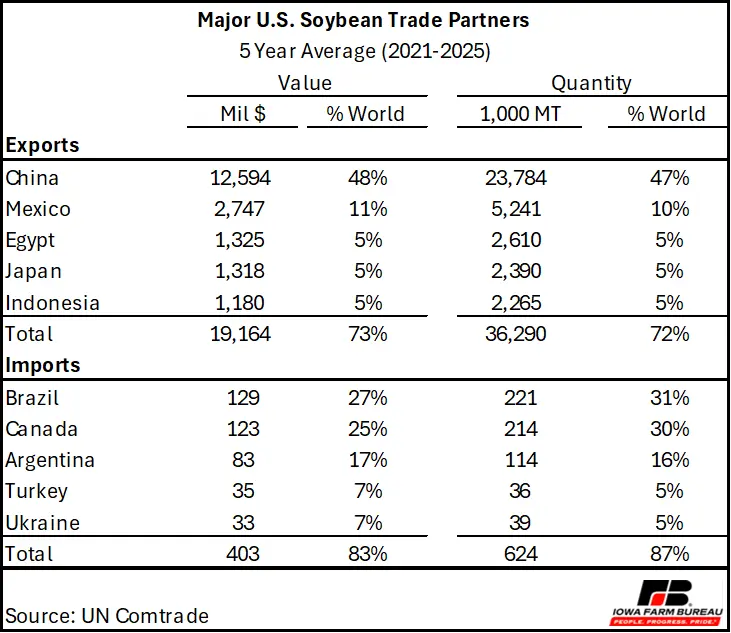
Throughout the past five years, China has remained the largest export market for U.S. soybeans (Table 2). On a five-year average basis, their share of total soybean exports has declined to less than half (47%) of all U.S. soybean exports in terms on volume although this is also true by value, as well. This shift reflects China’s minimal soybean purchases in 2025 relative to previous years. Mexico remains the second largest purchaser of U.S. soybeans account averaging 5.2 million MT annually over the past five years.
The United States’ position in the global soybean market has changed substantially with the rise of South American, particularly Brazil, production. Similarly, trade disputes with the largest global purchaser and consumer of soybeans, China, has put considerable pressure on the domestic market. Recent announcements confirm soybean purchases from China for the 2026/27 marketing year, beginning September 1, 2026.
Imports of soybeans in the U.S. are significantly less concentrated relative to export destinations. Brazil is the largest supplier of soybeans to the U.S. by volume and Canada is the largest supplier by value. Typically, the United States imports very few soybeans relative to what it exports.
Major Trade Partners of Other Major Global Soybean Exporters
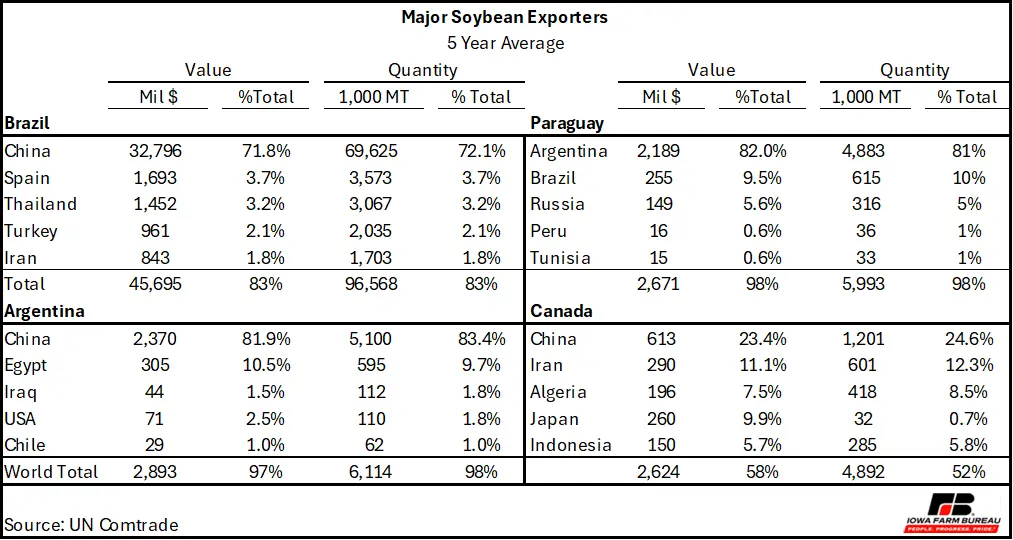
Table 3 highlights trade relationships of major global soybean exporters, other than the United States, on a five-year basis from 2020 to 2025.
Brazil has undoubtedly played a substantial role in shaping the current state of the global soybean market. Other major exporters like Paraguay, Argentina, and Canada export substantially lower volumes of soybeans relative to Brazil (Table 3). Over 72% of Brazil’s soybean exports are purchased by China.
Paraguay’s main export destinations are Argentina, Brazil, and Russia, with 81% of the country’s soybean export volume going to Argentina. Argentina exports the majority of their soybean exports to China (83%), with less than 10% of total soybean exports going to Egypt, Iraq, USA, and Chile. Around 25% of Canada’s soybean exports are exported to China, followed by Iran, Algeria, Japan, and Indonesia.
Major Trade Partners of Other Major Global Soybean Importers
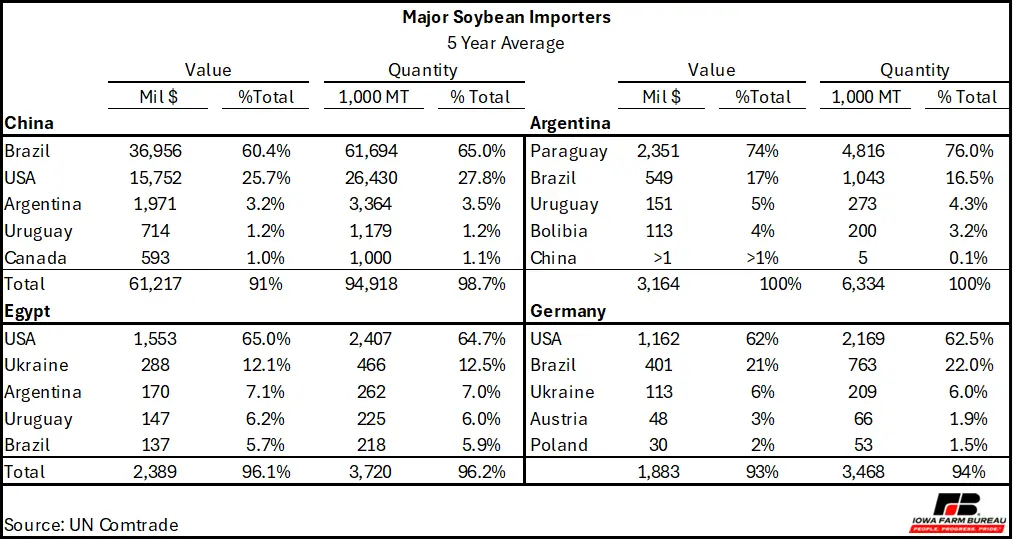
Table 4 highlights the trade relationships of major global soybean importers on a five-year average basis from 2020 to 2025.
China continues to be a major global purchaser of soybeans, with 65% of all soybean imports supplied by Brazil followed by the United States at 27.8%. Amid trade wars and negotiations, soybean exports to China have fallen dramatically; however, the share of total soybean imports supplied by Brazil and the United States has remained relatively the same on a five-year average basis (2020-2025) relative to the previous period (2019-2024).
Argentina imports the vast majority of soybeans from Paraguay (76%) followed by Brazil at 16.5%. Egypt and Germany continue to import over 60% of total soybean imports from the United States. Other major soybean suppliers to Egypt include Ukraine, Argentina, Uruguay, and Brazil. Germany, on the other hand, relies more heavily on trading partners from the European Union like Austria and Poland. Nonetheless, Brazil and Ukraine still remain the top second and third largest suppliers of soybeans to Germany.
Economic analysis provided by Paige Klipstein, Research Analyst, Decision Innovation Solutions on behalf of Iowa Farm Bureau
Find more information about alternative soybean products:
Want more news on this topic? Farm Bureau members may subscribe for a free email news service, featuring the farm and rural topics that interest them most!