Interest Expense Update
Author
Published
12/19/2022
Recap of Fed Rate Increases
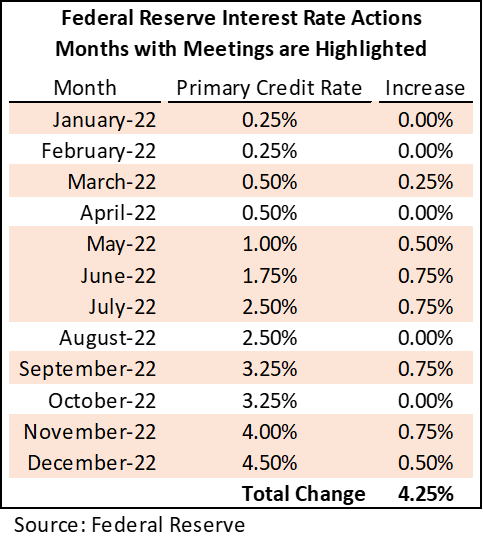
The Federal Reserve raised interest rates again on December 14, 2022. In total the Fed has raised interest rates seven times in 2022. These increases are shown in Table 1. The prime credit rate, the short-term rate banks charge their best customers, began the year at 0.25%. Rate increases began in March and now the primary credit rate sits at 4.5% up 4.25 percentage points from January 2022.
Table 1. Federal Reserve Interest Rate Actions
Internet Rates in Motion
Increases in the primary credit rate affect all interest rates but moves have larger effects on short term interest rates compared to long term interest rates. Monthly yields of U.S. Treasury bills, notes, and bonds by maturity length are shown in Figure 1. Notice longer term rates have not increased as much as short term rates, but both have moved up.
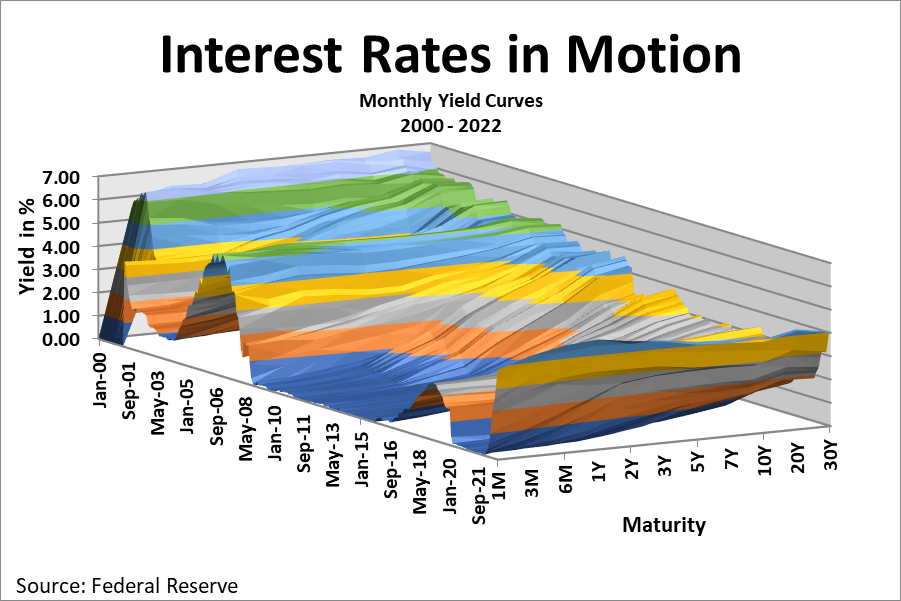
Figure 1. Interest Rates in Motion
Agriculture Loan Rates
Interest rates on agricultural loans have followed other interest rates up during the last year. The Federal Reserve Bank of Chicago reports quarterly average interest rates for operating and farm real estate loans. Both have increased substantially over the past year (Figure 2). In the 3rd quarter of 2021, farm operating loan interest rates sat at 4.3%. These rates increased to 6.5% in the 3rd quarter of 2022. Similarly, in the 3rd quarter of 2021, farm real estate loan interest rates sat at 4.0%. These rates increased to 6.1% in the 3rd quarter of 2022. Both rates will likely continue to move higher in the 4th quarter of 2022 as the Fed has continued to raise rates.
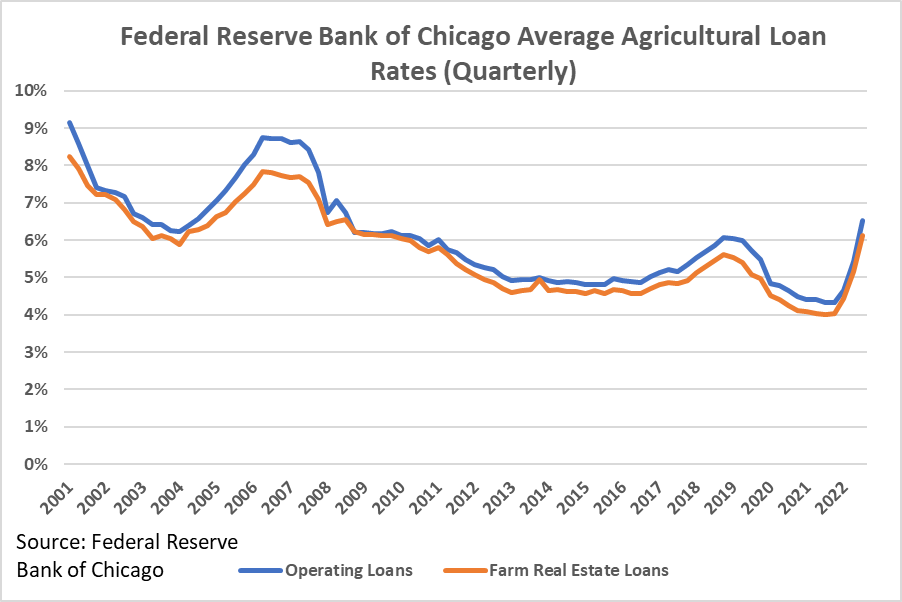
Figure 2. Federal Reserve Bank of Chicago Average Agricultural Loan Rates (Quaterly)
The USDA Farm Service Agency receives funding from Congress to administer the farm loans. FSA loans typically have favorable interest rates and terms as these loans are given to those who cannot obtain commercial credit. The goal of FSA loans is to have producers graduate to commercial credit. FSA rates have also increased substantially over the last year (Figure 3). Operating loan rates increased from 2.0% in December 2021 to 5.125% in December 2022. Similarly, direct farm ownership has increased from 2.875% a year ago to 5.0% now in December 2022.
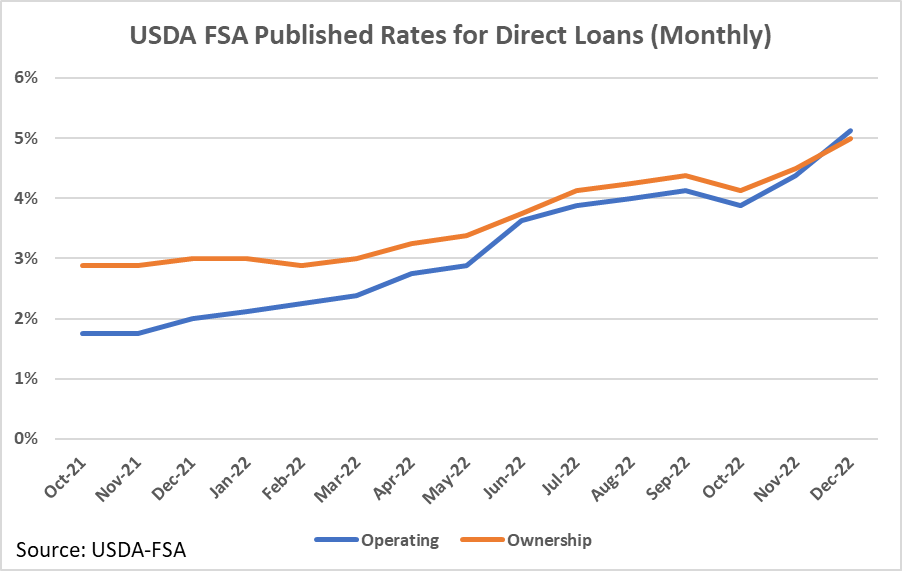
Figure 3. USDA FSA Published Rates fpr Dorict Loans (Monthly)
Interest Expense Ratio
One financial ratio to monitor during periods of increasing interest rates is the interest expense ratio. This ratio measures how much of an operation’s revenue or sales is used to pay interest expenses. Ideally this ratio would be under 5%, while a value over 10% could make an operation vulnerable to failure (Table 2).
Table 2. Interest Expense Ratio

Usually, this ratio does not get very high for the whole farm economy. The 1980s were an exception. Figure 4 shows the whole farm economy interest expense ratio for Iowa and U.S. This ratio exceeded 10% for much of the 1980s as rapidly rising interest rates and high debt levels combined to raise interest expenses. The 2022 forecast shows these ratios have not increased much in 2022 to the “caution” or “vulnerable” ranges but these ranges will be monitored heading into 2023.
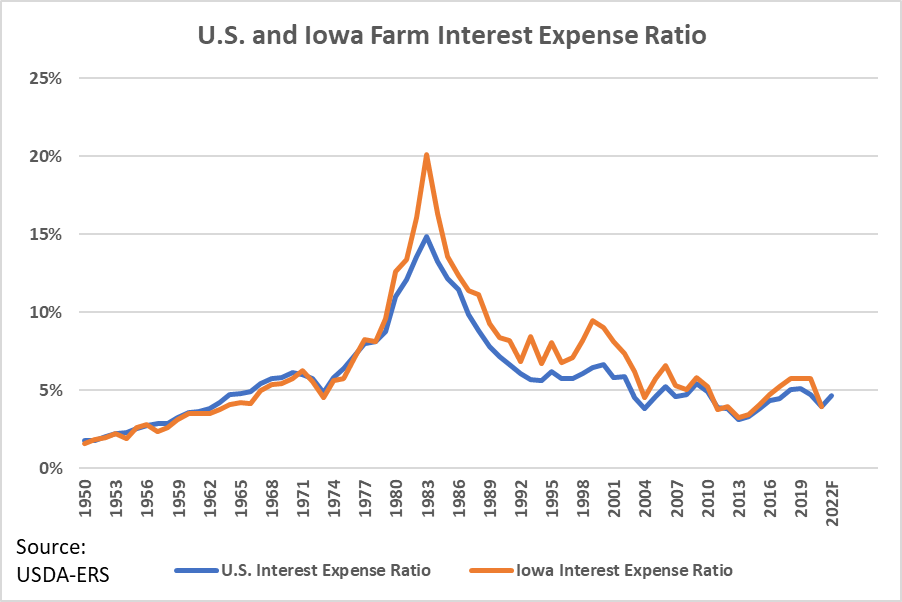
Figure 4. U.S. and Iowa Farm Interest Expense Ratio
Examples of Increasing Interest Expenses
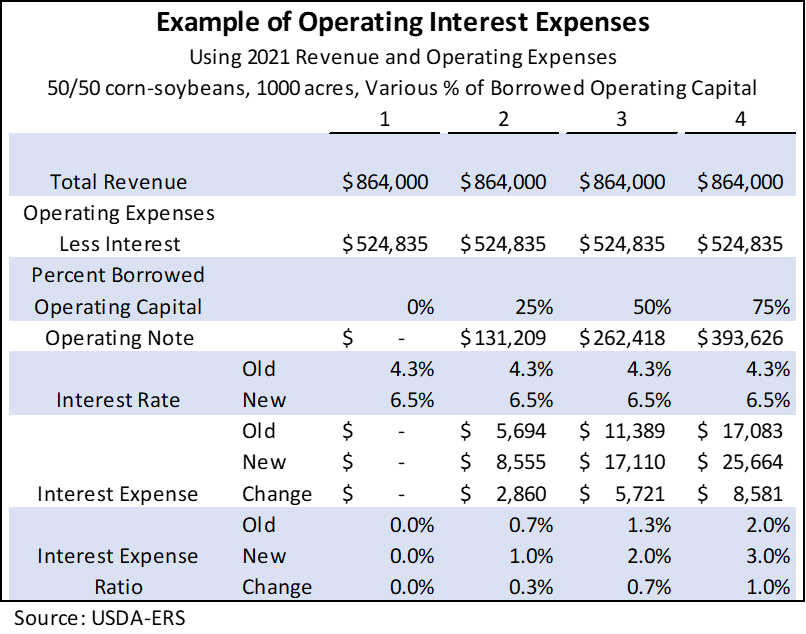
An example of the effect of rising interest rates on operating costs is shown in Table 3. Consider 4 scenarios of a farm with various levels of borrowed operating capital: 0%, 25%, 50%, and 75%. For simplicity, the example in Table 3 has no other money borrowed other than the operating loan.
Interest expenses and the interest expense ratio change more for farmers who borrow more money. Scenario 2 has an increase in interest expenses of about $3,000 and a change in their interest rate expense ratio of 0.3 percentage points due to the rising interest rate. In Scenario 4 these numbers are higher, $8,500 and 1.0 percentage points, respectively.
Table 3. Example of Operating Interest Expenses
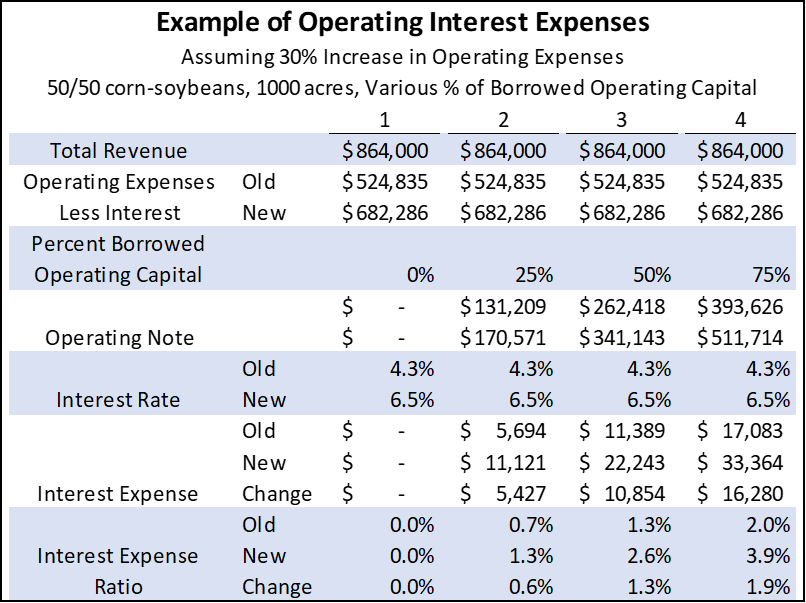
Besides the fact that interest rates are increasing, prices for most inputs are also increasing. This will have a double negative impact on some farmers who borrow operating capital. First, they will have to borrow more due to higher costs for inputs. Second, they will have to pay more interest on what they borrow. Table 4 provides the same example as Table 3, but has operating expenses increase in the new year, rising by 30% compared to the old year. The rise in costs effects the interest expense of all farmers who borrow money, but the combined effect of higher input costs and interest rates has large effects on farmers who borrow more. Scenario 2 has an increase in interest expenses of about $5,500 and a change in their interest rate expense ratio of 0.6 percentage points. Again, in Scenario 4 these changes are much larger, these numbers increase to $16,000 and 1.9 percentage points respectively.
Table 4. Example of Operating Interest Expenses
So far, none of the scenarios have had interest expense ratios above 5%. But in the scenarios above, the only loan considered is the operating loan. Many farmers also have longer term loans for machinery, buildings, or land. These loans on top of the above operating loans would make the interest expense ratios even higher. Farmers with high amounts of money borrowed for assets will have higher interest expense ratios closer to the “caution” and “vulnerable” ranges.
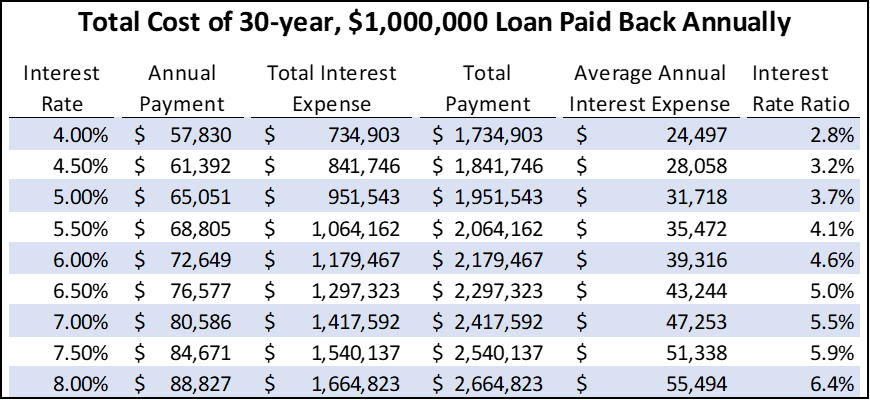
Table 5 shows an example of a $1,000,000, 30-year loan at various interest rates. Interest payments on long-term loans vary over time, with more interest and less principle paid earlier in the loan to keep total payments equal over the whole loan. For comparison to Table 3 and Table 4, an average annual interest expense is used to calculate an interest expense ratio with the same annual revenue as the example farm in to Table 3 and Table 4. Any of these ratios can be added to the ratios of the scenarios above to approximate the total farm interest expense ratio with the operating loan and the $1,000,000 long-term loan.
Even if long-term loans are at fixed interest rates, farms with higher debt loads already near the “caution” or “vulnerable” ranges, could get pushed into these ranges with rising operating loan rates. For example, consider again scenario 3 in Table 4. In the old year scenario 3 had an interest expense ratio of 1.3%. Assume this farm also has a 30-year, $1,000,000 loan at a fixed rate of 4.5% that is has been paying off for a few years. This would increase their interest expense ratio approximately 3.2 percentage points to 4.5% in the old year, still below the benchmark of 5%. However, increases in operating expenses and interest rates in the new year push their interest expense ratio up 1.3 more percentage points, to a total of 5.8%. When considering a prior long-term loan, the increase in interest rates on the operating loan pushed this farm’s interest expense ratio out of the “strong” zone and into the “caution” zone.
Table 5. Total Cost of 30-year, $1,000,000 Loan Paid Back Annually
Conclusion
The combination of rising interest rates and input costs is likely to put pressure on farmers this year. Farmers with less capital on hand, or who have higher debt levels will be the most affected. These will likely be younger or beginning farmers who have not had time to build up equity and working capital, leaving them vulnerable to interest rate increases. Farmers who expanded aggressively in the prior years when interest rates were much lower could also be vulnerable if they expanded too aggressively and were not prepared for these higher interest rates and expenses.
Economic analysis provided by Aaron Gerdts, Research Analyst, Decision Innovation Solutions on behalf of Iowa Farm Bureau.
Want more news on this topic? Farm Bureau members may subscribe for a free email news service, featuring the farm and rural topics that interest them most!