Hog Market Update: June 2023
Author
Published
6/30/2023
The USDA released its quarterly estimate of the inventory of all hogs and pigs in the U.S. on June 29, 2023. On June 1, 2023, US hog inventory was 72.4 million head, up slightly from last year (Figure 1). Compared to the last quarter, hog inventory was 1% lower. This is not unusual as March and June inventories are typically lower than September and December. Hog inventories remain well below recent peaks in 2019.
Market hogs make up most US hogs, representing 92% of all US hogs. So, movements in total hog inventory are primarily due to changes in market hog inventory. Market hog inventory was 66.2 million head, up slightly from last year (Figure 2). Breeding hog inventory totaled 6.1 million head, down 0.4% from last year (Figure 3).
Iowa’s hog inventory was 23.8 million head, up 3.5% from last year. In Iowa, 96% of all hogs in Iowa are market hogs. This is a higher than the US share as Iowa not only finishes the pigs that are farrowed here, it also finishes feeder pigs from other states and Canada. Market hog inventory was 22.9 million head, up 1% from last year. Breeding hog inventory was 900,000 head, down 4.3% from 940,000 head the same time last year.
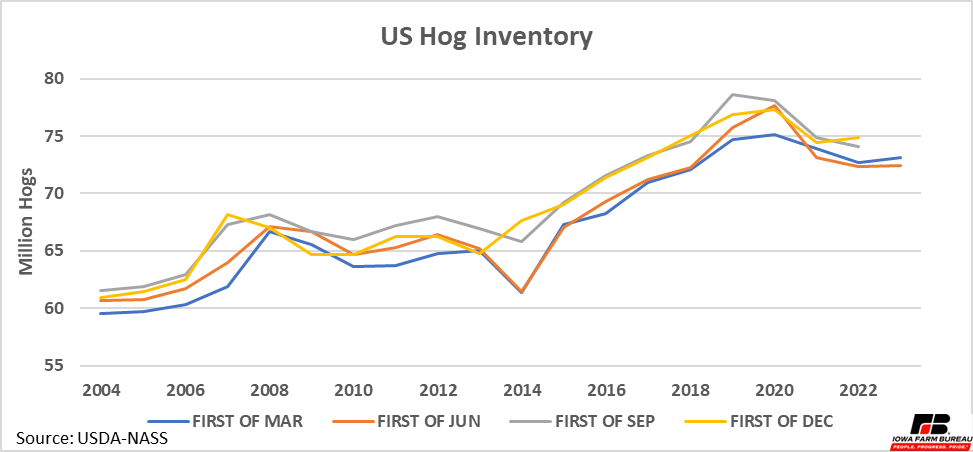
Figure 1. US Hog Inventory
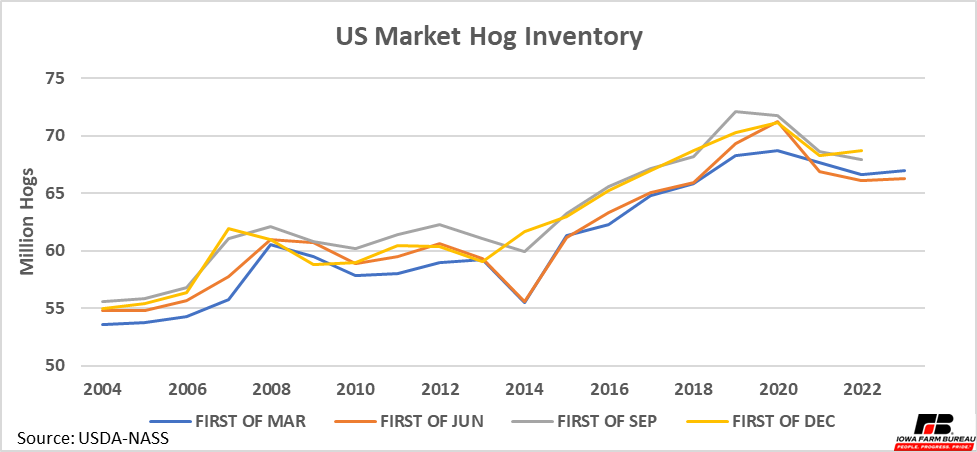
Figure 2. US Market Hog Inventory
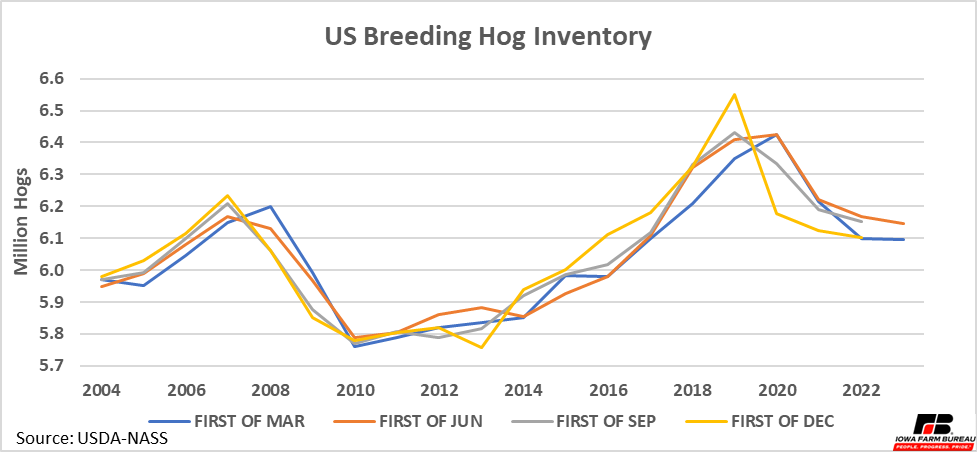
Figure 3. US Breeding Hog Inventory
Pig Crop
The US March-May pig crop was 32.9 million head, up almost 1% from last year (Figure 4). Note the pig crop increased even with fewer sows on hand and fewer sows farrowed. The US farrowed 2.90 million sows this past quarter as opposed to 2.97 million sows a year ago. The increase in the pig crop was due to a relatively large increase in litter rates. Litters averaged 11.36 pigs per litter, up from 11.00 a year ago and higher than any other quarter on record. Litter rates had been relatively stagnant since about 2020 after years of consistent gains. This may be a sign litter rates are set to begin growing again.
In Iowa, the March to May pig crop was 5.4 million head, down 5.6% from 5.7 million head a year ago. This loss was due to lower sows farrowed as Iowa litter rates were also up. Iowa’s litter rate this past quarter was 11.75 pigs pre litter, which was also a record quarter for Iowa. Iowa farrowed a total of 460,000 sows down 8% from the 500,000 sows farrowed a year ago.
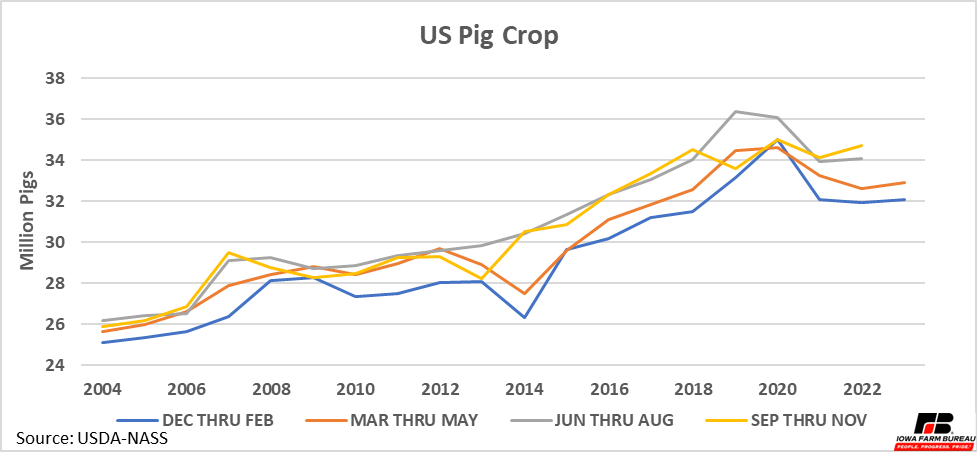
Figure 4. US Pig Crop
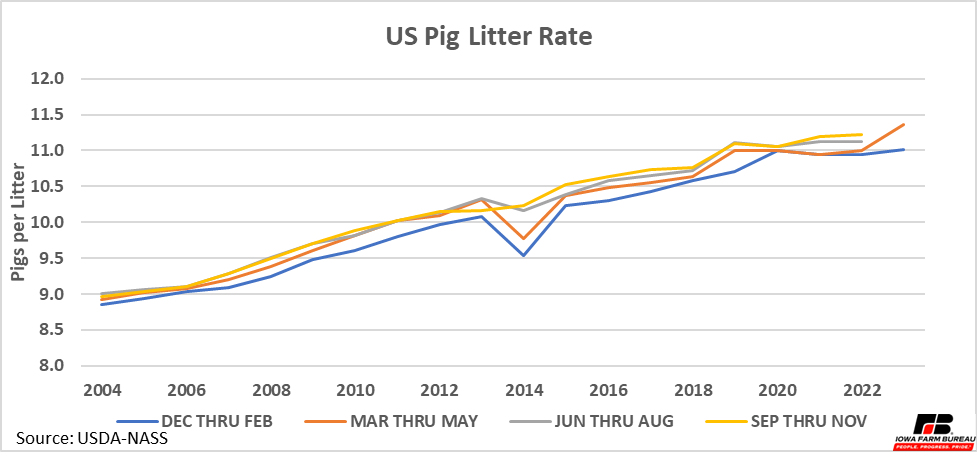
Figure 5 US Pig Litter Rate
Exports
Pork exports started the year at roughly the same pace as 2022. However, over the past few months they have continued to increase past 2022 levels and now sit up almost 9% year-over-year.
In 2020 and 2021 exports were much higher as China was buying US pork to compensate for their own domestic production loses from African Swine fever. Without China as a major buyer, it is difficult for US exports to hit those past levels.
Data from USDA-FAS GATS database also shows the total value of pork exports has increased this year compared to last year. Even after adjusting for inflation the value of pork exports is still up about 7%. This combined with the fact that volumes of exports have increased indicate US pork exports are stronger this year.
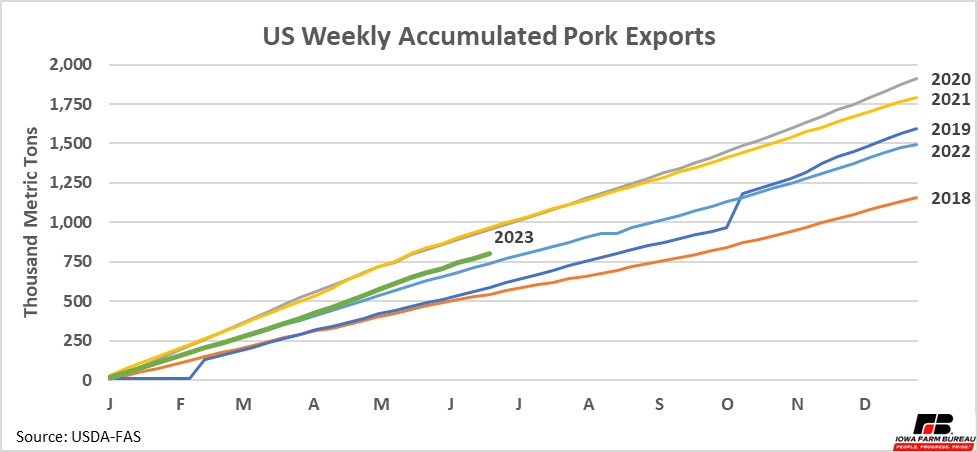
Figure 6. US Weekly Accumulated Pork Exports
Cash Prices
During the first half of 2023, the net price received for hogs was relatively consistent, around $80/cwt on a carcass basis (Figure 7). As is typical of past years, prices began trending up slightly heading into summer months. Outside of 2020 when COVID was affecting the market, net hog prices received have typically peaked in the summer months and are at a low point in the winter months. After accounting for inflation, 2023 hog prices have following the 2015-19 average very closely. If no new shocks hit the market, prices are expected to follow the seasonal trend down for the remainder of the year.
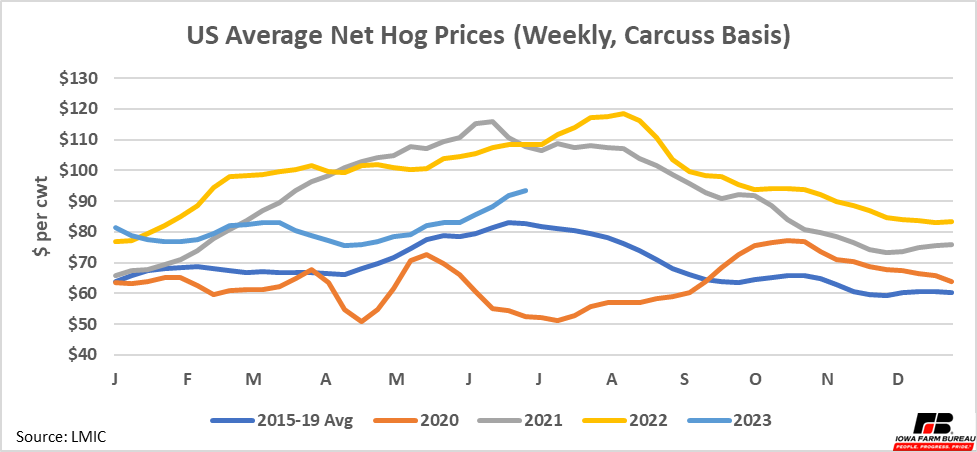
Figure 7. US Average Barrow & Gilt Prices
Futures
Around the beginning of June hog futures began to trend upward after trending down since March. Summer futures prices are higher than fall futures prices, which is a typical seasonal trend in hog prices. (Figure 8).
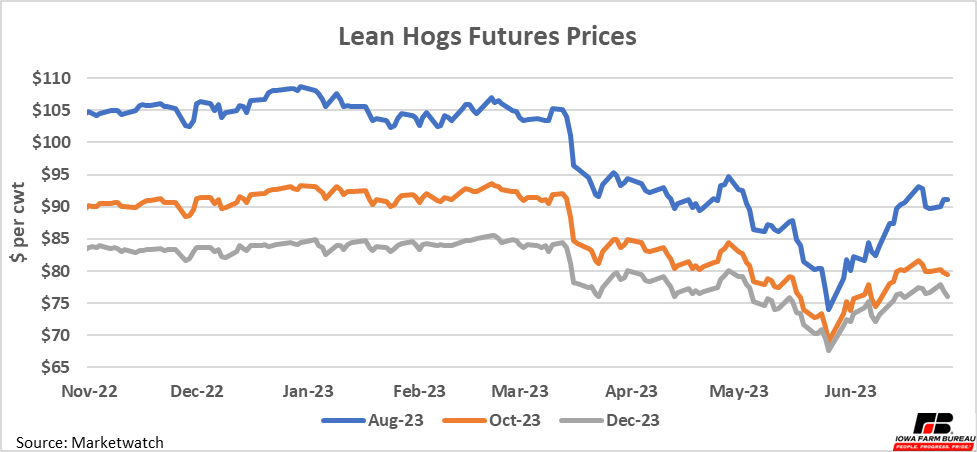
Figure 8. Lean Hog Futures Prices
Costs and Returns in Iowa
Iowa State University publishes monthly estimates of costs and returns to livestock production, including various aspects of hog production. Note these are industry-wide estimates and do not necessarily reflect the returns of any individual operation.
Figure 9 shows revenue costs and returns for a farrow to finish operation. Hog production costs throughout 2023 have been much higher than in previous years. Corn and other non-feed variable costs are the largest contributors to the rise in estimated costs, though other categories are up as well. Even as prices have come down from highs last summer, costs continued to rise, turning average hog returns negative.
Figure 9 data only runs through May 2023, so the rise of prices in June is not yet incorporated. However, it is unlikely even June prices will make hog production profitable in June. Losses to hog production in 2023 have been some of the largest and most persistent losses in years. There is no obvious relief to these costs in the short run.
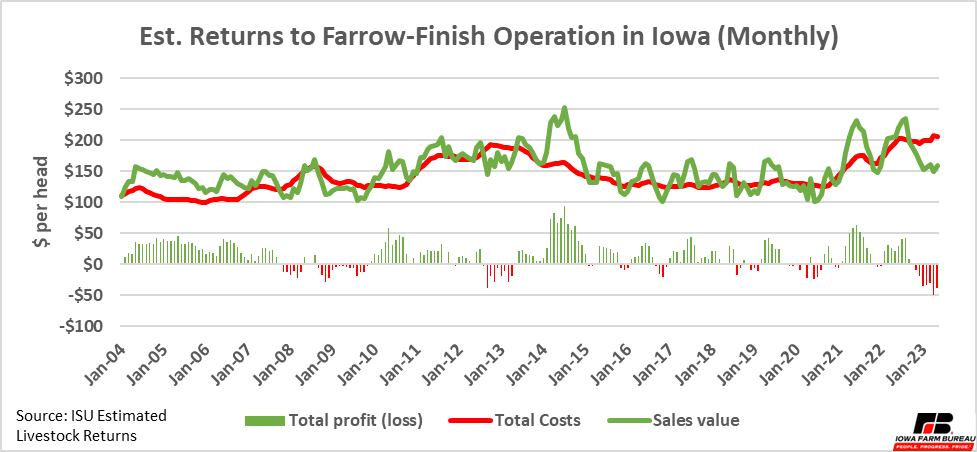
Figure 9. Estimated Returns to Farrow-Finish Operation in Iowa
Takeaways
Hog inventories show a seasonal movement, typically lowest in March and highest in September. Litter rates also follow a seasonal pattern with the lowest litter rates in the winter months from December-February and the highest litter rates September-November. Year-over-year hog inventories are up slightly from last year but still below recent peaks in 2019. Growth in litter rates had been relatively slow over the past few years compared to the previous 20 years, but this past quarter, USDA shows litter rates took a big step forward, setting a record.
Total pork exports this year have picked up compared to last year. Exports by weight and value are up compared to last year, indicating pork export demand is strengthening.
Hog prices have started this year relatively high but did not show the same 1st and 2nd quarter gains as in 2021 and 2022. Hog prices in 2023 have followed the 2015-19 average relatively closely after accounting for inflation. This trend appears likely to continue unless large supply or demand shocks impact the market.
Lean hog futures have exited their downward trend that was in place since the first of the year and now have been in an uptrend since the beginning of June. Summer futures are higher than fall and winter futures, which is typical of seasonal hog price patterns.
Costs have continued to increase despite price declines and have created large losses for hog producers. These losses unfortunately appear likely to continue until feed costs decline since there is a relatively strong pig crop keeping supply supported.
Economic analysis provided by Aaron Gerdts, Research Analyst, Decision Innovation Solutions on behalf of Iowa Farm Bureau.
Want more news on this topic? Farm Bureau members may subscribe for a free email news service, featuring the farm and rural topics that interest them most!