Canada, China, and Mexico Top Markets for U.S. Agricultural Products in 2017 Calendar Year
Author
Published
3/1/2018
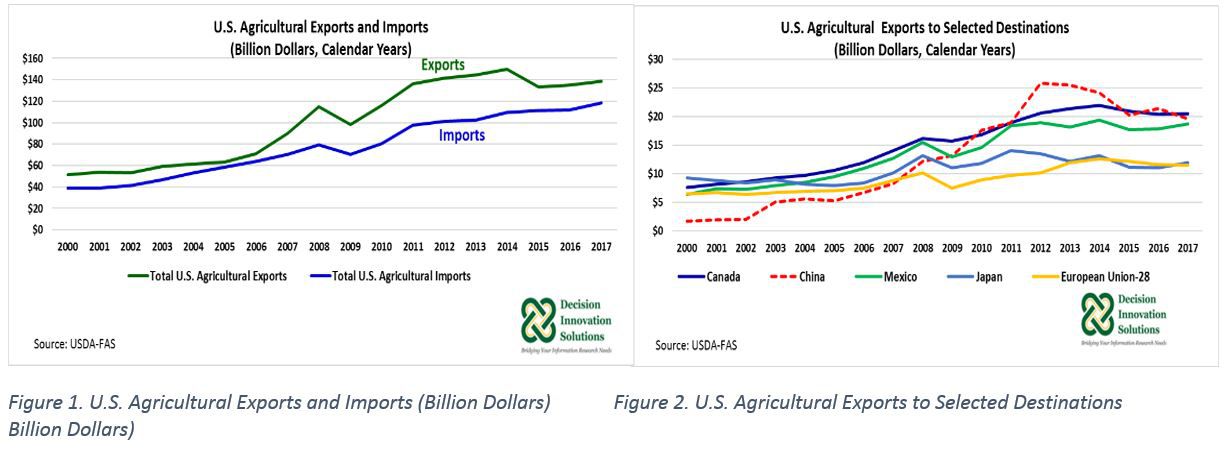
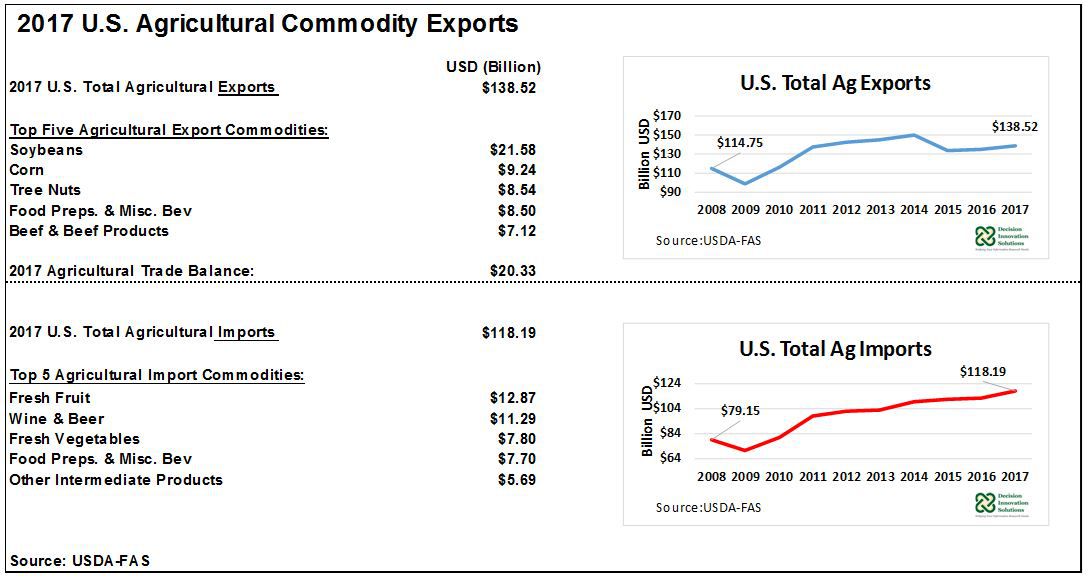
USDA-FAS agricultural trade data indicates the United States shipped $138.5 billion worth of agricultural products around the world in the 2017 calendar year, up 2.8 percent from 2016 ($134.8 billion). This was the third consecutive year of U.S. agricultural export expansion, but 2017 exports remained below the 2013 record high of $144.3 billion. U.S. agricultural imports also increased in 2017, from $112.0 billion in 2016 to $118.2 in 2017, narrowing the U.S. agricultural trade gap from $22.8 billion, the surplus in 2016, to $20.3 billion, the surplus in 2017 (see Figure 1).
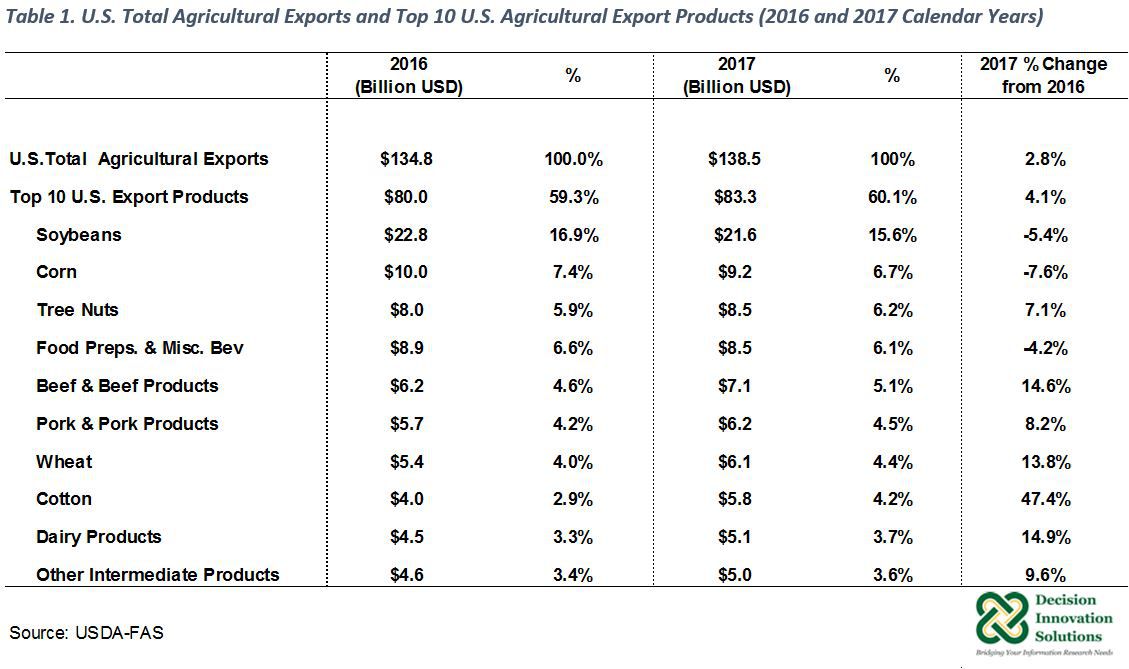
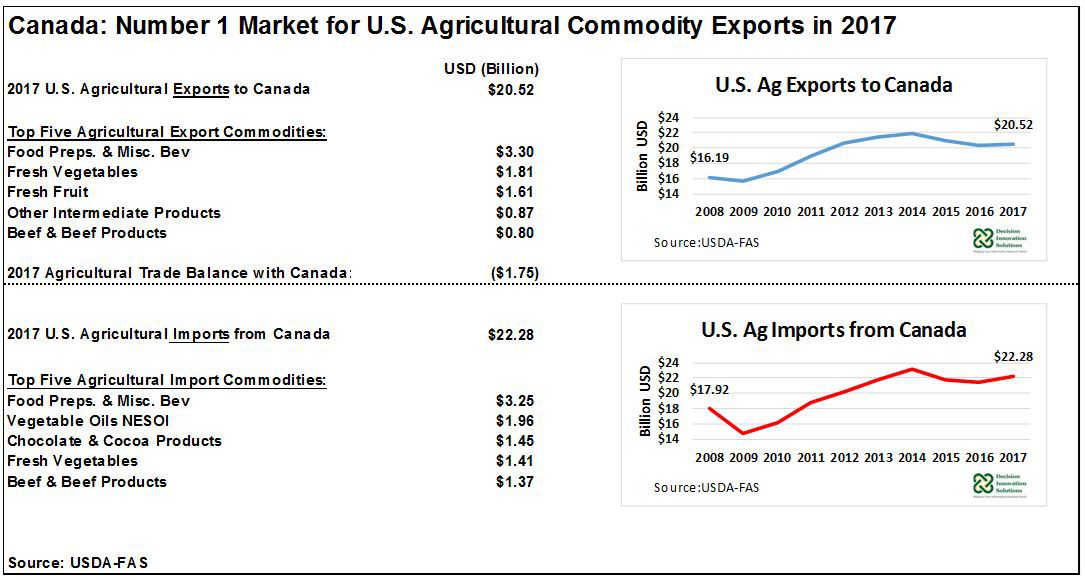
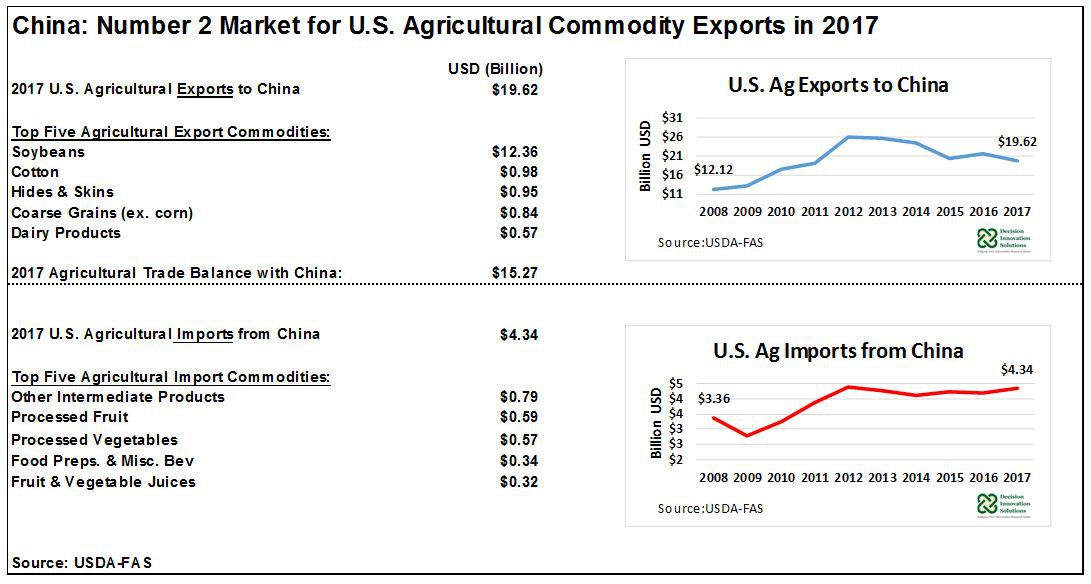
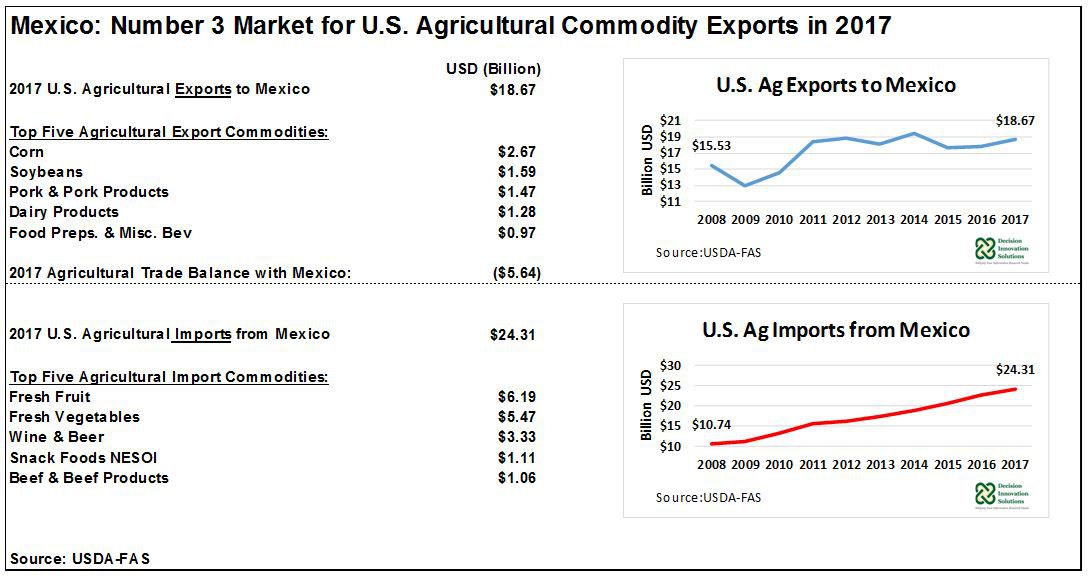
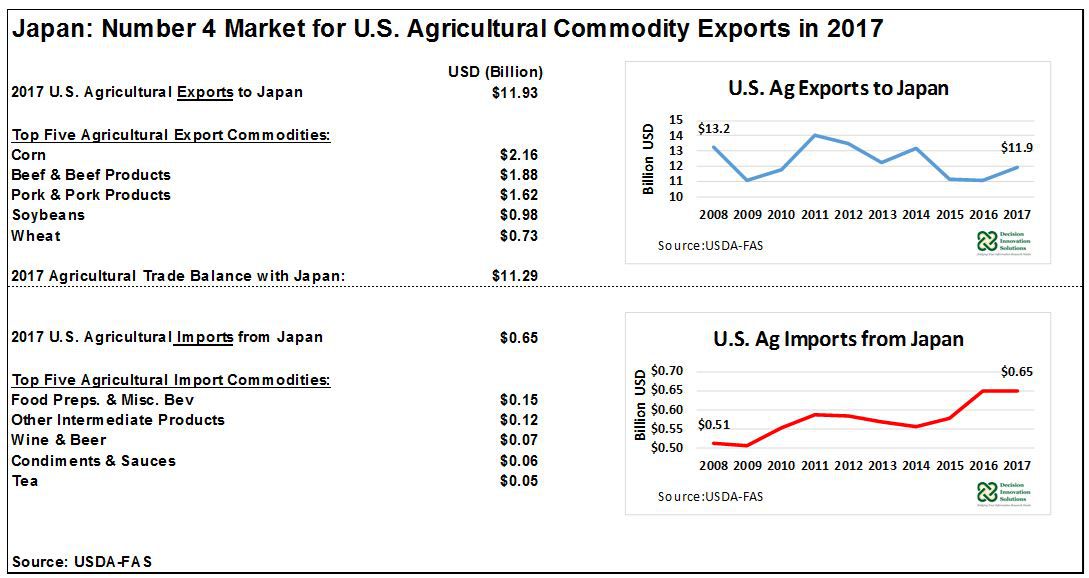
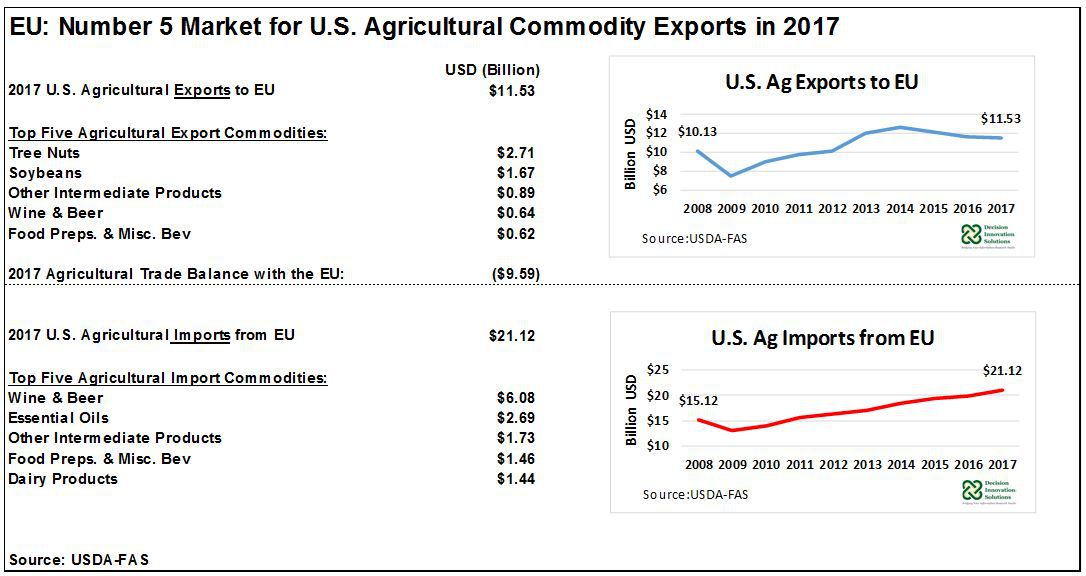
The 2017 top five destinations for U.S. agricultural products were Canada ($20.5 billion, 14.8 percent share of U.S. exports), China ($19.6 billion, 14.2 percent share of U.S. exports), Mexico ($18.7 billion, 13.5 percent share of U.S. exports), Japan ($11.9 billion, 8.6 percent), and the European Union (EU, $11.5 billion, 8.3 percent) (see Figure 2). These top five markets made up 59.4 percent of U.S. total agricultural exports in 2017. 2017 U.S. agricultural exports were up for Japan, Mexico, and Canada, by 8.1 percent, 4.5 and 0.9 percent, percent, respectively, compared with the previous year. On the other hand, 2017 U.S. exports to China and EU where down 8.3 percent and 0.4 percent, accordingly, relative to 2016 (see Figure 2).
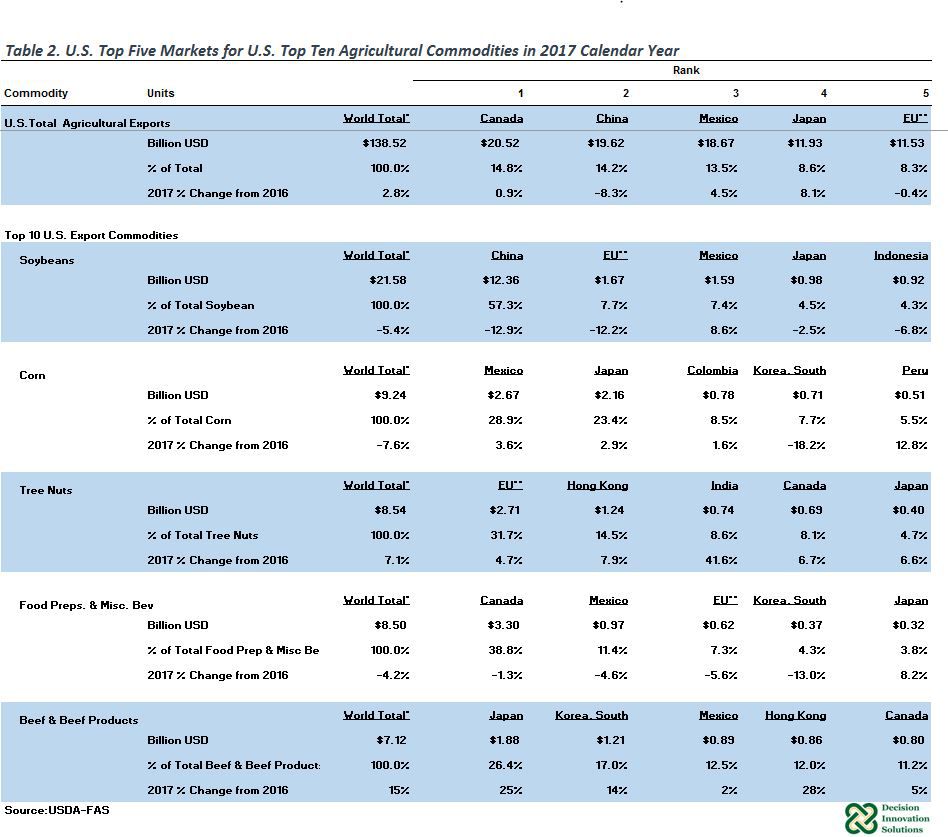
Soybeans were the number one U.S. agricultural export commodity in the 2017 calendar year with a value of $21.6 billion and a share of 15.6 percent of total U.S. agricultural exports. In addition, corn, tree nuts, food preparations & miscellaneous beverages, beef & beef products, and pork & pork products were among the top ten U.S. agricultural export commodities in 2017. Overall, the top ten commodities made up 60.1 percent ($83.3 billion) of total 2017 U.S. agricultural exports (see Table 1).
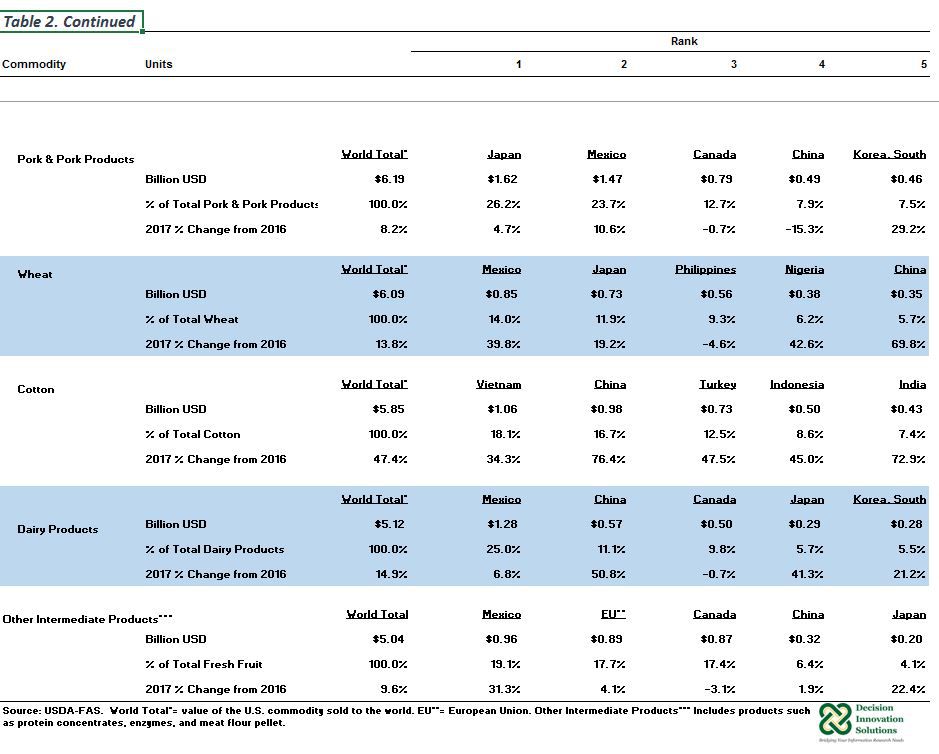
2017 U.S. exports of tree nuts ($8.5 billion), beef & beef products ($7.1 billion), pork & pork products ($6.2 billion) were up 7.1 percent, 14.6 percent, and 8.2 percent year over year, respectively. The top five markets for both U.S. tree nuts and beef & beef products grew in 2017 compared with 2016 (see Table 2). In the case of beef & beef products, the five top markets’ share was 79.1 percent of total U.S. beef & beef product exports. For pork & pork products, U.S. exports to Japan, Mexico and South Korea increased 4.7 percent to $1.62 billion, 10.6 percent to $1.47 billion, and 29.2 percent to $0.46 billion in 2017 relative to 2016 (see Table 2). Despite U.S. pork & pork product export declines to Canada (0.7 percent) and China (15.3 percent) in 2017 from the previous year, U.S. pork & pork product exports registered the second largest value since 2014 ($6.5 billion).
U.S. soybean exports declined 5.4 percent during 2017 calendar year compared with the previous year, reflecting lower U.S. soybean exports to China, the main market for U.S. soybeans. In 2017 U.S. soybean exports to China made up 57.3 percent ($12.4 billion) of U.S. total soybean export value (see Table 2) and 63.0 percent of 2017 U.S. total agricultural products exported to China ($19.6 billion). In addition, exports to EU, Japan, and Indonesia, which in 2017 had 7.7 percent, 4.5 percent, and 4.3 percent share of U.S. total soybean exports, respectively, declined 12.2 percent, 2.5 percent, and 6.8 percent, correspondingly (see Table 2). Among the top five markets for U.S. soybean in 2017, only exports to Mexico were up 8.6 percent to $1.59 billion year over year. The United States is facing a strong competition mainly from Brazil, the global leading exporter of soybeans. Despite last year’s decline, soybeans continued as the main U.S. agricultural export commodity. Since 2000 (except 2006 when corn was the number one U.S. export commodity), soybeans’ share of total U.S. agricultural exports averaged 14.3 percent during the 17-year period.
U.S. exports of corn ($9.2 billion), and food preparations & miscellaneous beverages ($8.5 billion) were down 7.6 percent and 4.2 percent in the 2017 calendar year from their corresponding values in 2016, accordingly (see Table 1). 2017 U.S. corn exports to Mexico ($2.67 billion) and Japan ($2.16 billion), the two largest markets for U.S. corn, were up 3.6 percent and 2.9 percent, respectively, compared with the previous year (Table 2). Exports to these two markets comprised 52.2 percent of total 2017 U.S. corn exports. In addition, 2017 U.S. corn exports to Colombia ($0.78 billion), and Peru ($0.50 billion), the third and fifth largest markets for U.S. corn in 2017, were up 1.6 percent and 12.8 percent, respectively, year over year. Despite U.S. corn exports expansion in these four markets in the 2017 calendar year, total U.S. corn exports declined 7.6 percent last year, reflecting lower export values among other markets and the impact of declining corn price. 2017 U.S. corn exports dropped for South Korea (18.2 percent), Taiwan (13.6 percent), Saudi Arabia (22.1 percent), Venezuela (71.4 percent), Guatemala (16.6 percent), and Egypt (80.8 percent), as well as exports to the rest of the world (20.4 percent). Decline in these markets were large enough to offset U.S. exports increases in major markets such as Mexico, Japan, Colombia, and Peru during the 2017 calendar year. The United States is facing increased competition from Brazil and Argentina, which is hindering U.S. corn exports.
2017 U.S. Agricultural Trade Summary
Over 20 percent of U.S. farm products by value are exported each year, making trade a key component for U.S. agricultural sustainability and growth. Canada finished as the United States’ leading export market in the 2017 calendar year, followed closely by China and Mexico. Also, important customers for U.S. agricultural products in calendar year 2017 were Japan and EU. These five markets made up about 60 percent ($82.3 billion) of the value of U.S. total agricultural exports ($138.5 billion). Depending on particular commodities, there were other key agricultural markets in 2017 calendar year. For instance, Colombia and Peru (corn’s 3rd and 5th leading markets, respectively), South Korea (2nd largest market for beef & beef products and 5th largest customer for both pork & pork products and dairy products), and Indonesia (a distant 5th largest market for soybean).
Overall, The United States was a net exporter (i.e., exports surpassed imports) of agricultural products in 2017 calendar year, with a trade surplus of $20.33 billion; however, the United States had an agricultural trade deficit (i.e., imports surpassed exports) with Mexico, Canada, and EU. These three countries were the United States’ largest suppliers of agricultural products ($24.3 billion, $22.3 billion, and $21.1 billion in 2017, respectively). Most of the U.S. agricultural imports from Mexico consisted of fresh fruits, fresh vegetables, and wine and beer. The top three agricultural products imported by the United States from Canada were food preparations & miscellaneous beverages, vegetable oils NESOI, and chocolate & cocoa products. The bulk of U.S. agricultural imports from the EU was imports of wine & beer, essential oils, and oter intermediate products. Details of overall U.S. agricultural trade as well U.S. trade with the top five markets is presented below.
Want more news on this topic? Farm Bureau members may subscribe for a free email news service, featuring the farm and rural topics that interest them most!