2017 U.S. Farm Income Forecast: Changes Throughout the Year
Author
Published
12/12/2017
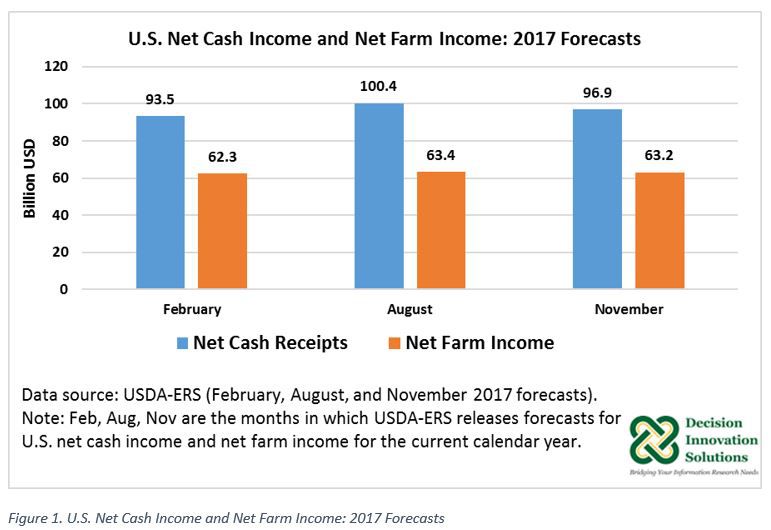
The November 29, 2017 release for the 2017 farm income forecast published by USDA-ERS, is forecasting U.S. net cash income (gross cash income[1] minus cash expenses) to increase 3.9 percent ($3.7 billion) to $96.9 billion year-over-year. 2017 net farm income (total gross income[2] minus total expenses) is forecast up $1.7 billion to $63.2 billion compared with 2016 ($61.5 billion). If realized, this would be the first year U.S. net farm income reverses the declining trend that started in 2014, when it fell to $92.4 billion from the value in 2013 ($123.8 billion).
USDA-ERS releases three U.S. farm income forecasts, which happen in February, August, and November of each calendar year. In addition, there is one more forecast (February of following year) and one estimate (August of following year). Depending on the availability of new data, income estimates can have more revisions. Overall, USDA-ERS adjusts its forecast model based on new information available by the time of each release. Figure 1 shows the forecasts for U.S. net cash income and U.S. net farm income for 2017 throughout the current calendar year. Among the three forecasts, the most optimistic was the one released in August 2017.
Why Forecasts Vary: The Development of U.S. Farm Income Forecast/Estimate
According to USDA-ERS, typically each year, the first farm income forecast, which happens in February, is based on limited information. The forecast is formulated before planting intentions are known; therefore, production which varies with weather, prices and other factors are undetermined. Global production, which in many cases is unspecified at that time, can affect domestic producers’ decisions. Input prices, debt, inventories, and participation in government programs also influence producers’ decisions.
The August (second) forecast incorporates the first survey-based information on crop production for the crop marketing year. Other information such as animal/animal product domestic production and use, international production, consumption, and trade, is incorporated in the forecast model. All this information contributes to a better price forecast and a more refined forecast.
The last (third) forecast of the calendar year published in November includes the most current price data available. Other information incorporated into the November forecast is updated current-year harvest, sales, and inventory data.
The November forecast continues to be fine-tuned since in February of the following year (fourth forecast) there is a new forecast. This forecast includes monthly price information that was not available at the time of the third forecast (November). Also, by the time of the fourth forecast, there is marketing pattern data that allows determining when crop sales actually occurred.
The fourth forecast is changed to an estimate in the following USDA-ERS forecast release of the year, which happens in August. At that time NASS estimates of U.S. and States production and expenses data collected by survey through the year in question are available through the Agricultural Resource Management Surveys (ARMS).
Overall, for each calendar year, from first forecast to estimate, the U.S. farm income is fine-tuned across nineteen months. So, 2017 calendar year farm income will still go through two more adjustments occurring in February and August 2018.
The process described above is what typically happens each year; however, farm income estimates can be changed when new data is available. For instance, the November 2017 release adjusted the 2016 net cash income and net farm income estimates. The November 2017 estimate for 2016 net cash income was up by $4.1 billion to $93.3 billion compared with the August 2017 estimate for that year ($89.2 billion). Consulting with USDA-ERS, this revision reflects new data on 2016/17 monthly marketing year patterns from USDA-NASS. USDA-ERS uses the monthly marketing patterns data to estimate what was sold from current production versus what sold from inventories. Most of the revision for 2016 released in November 2017 was due to soybeans’ new marketing pattern data. The revision to 2016 crop cash receipts were mostly offset by a corresponding revision to the crop inventory adjustment, mainly for soybeans. With the inventory adjustment, the November 2017 release for 2016 net farm income slightly changed from $61.513 billion, the estimate release in August 2017, to $61.525, the estimate released in November 2017. This indicates an increase of $12.141 million.
Since the November 2017 release for the 2017 farm income forecast included the most current data available of the current calendar year, this third forecast will most likely stay close to the revisions in February 2018 and August 2018 for the 2017 farm income.
Want more news on this topic? Farm Bureau members may subscribe for a free email news service, featuring the farm and rural topics that interest them most!