USDA lowers yield estimates but ending stocks higher than expected
Author
Published
9/12/2023
The USDA released its updated WASDE report on September 12, 2023. The September report is the first report with objective field samples of corn and soybeans to help forecast yields. Given this, the market was primarily watching yield estimates headed into the report.
WASDE yields estimates for both corn and soybeans were down from August estimates but near market expectations. Overall production estimates were also near market projections for both crops. Despite unsurprising yield and production estimates, the market’s initial reaction to the report was still bearish for both crops. Ending stocks both domestically and globally were higher than market expectations due primarily to small increases in expected harvested acres.
Table 1. September 2023 USDA WASDE vs Market Expectations

Changes to Domestic Balance Sheets
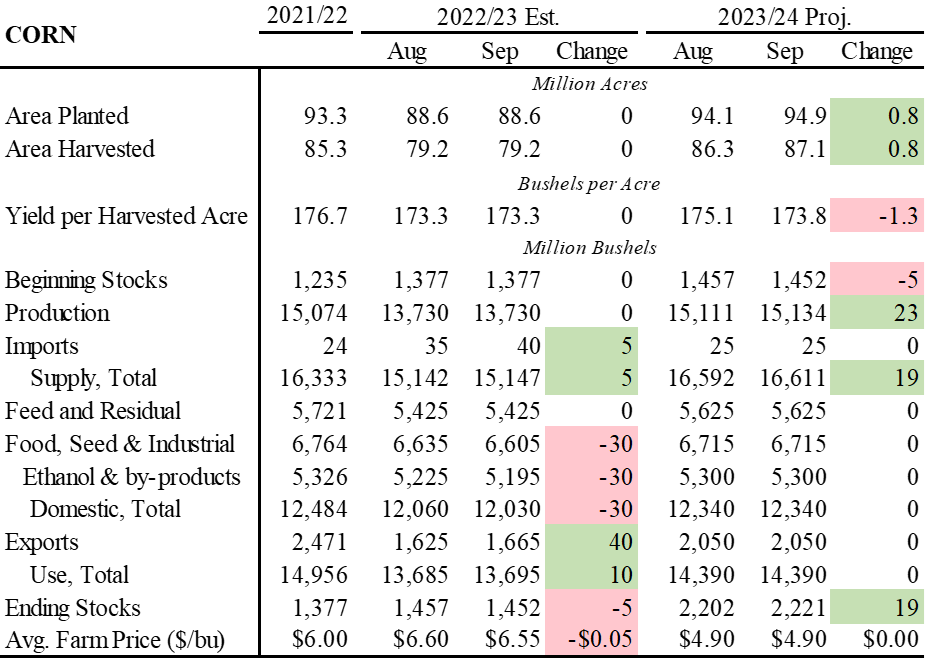
For corn, old crop changes were mostly offsetting with exports and imports both increasing, and ethanol use decreasing. After all the adjustments, last year’s ending stocks were lowered 5 million bushels, a relatively small change.
All new crop changes for corn were on the supply side. The yield was lowered but projected harvested acres were increased. This left total corn production slightly higher. There was a small offset from lower beginning stocks as discussed above, leaving expected corn ending stocks 19 million bushels higher than last month’s estimate.
Table 2. September 2023 WASDE Corn Balance Sheet
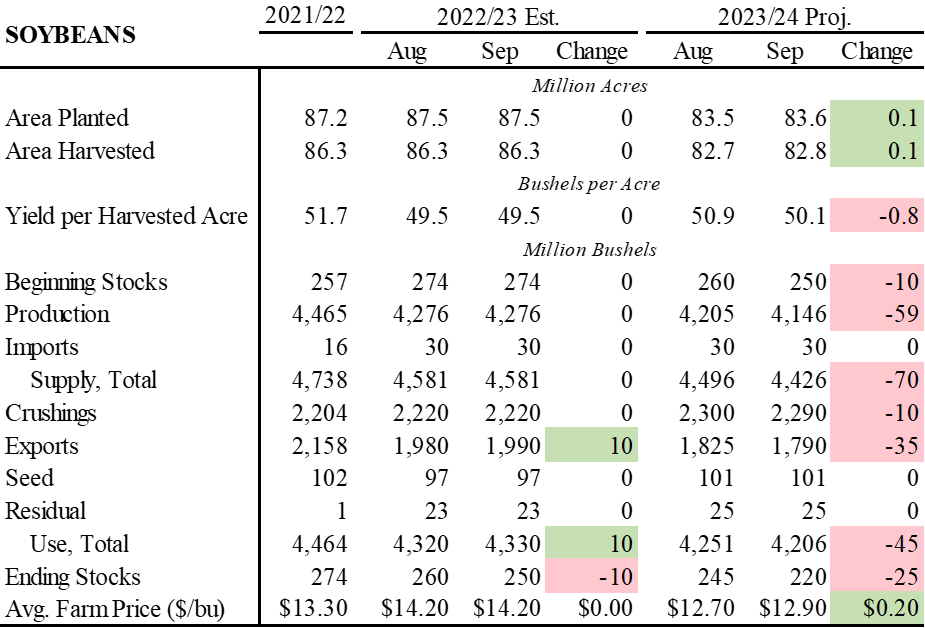
Old crop soybeans saw only one change. Exports were raised 10 million bushels, leaving old crop ending stocks 10 million bushels lower. For the new crop, expected acres were raised slightly and yields were lowered. Unlike corn, these adjustments left total production down 59 million bushels from last month's estimate. As is typical for the USDA, estimates for use were lowered in conjunction with lower expected production. Domestic crush and exports were lowered a combined 45 million bushels. All in all, the ending stocks estimate for new crop soybeans was lowered 25 million bushels. Tighter ending stocks prompted the USDA to raise its new crop average farm price estimate $0.20/bu to $12.90/bu.
Table 3. September 2023 WASDE Soybean Balance Sheet
State by State Yield Projections
State by state yield estimates for corn and soybeans compared to the previous month are shown in Figure 1 and Figure 2.
Corn yield estimates were lowered in the upper Midwest states including Iowa in the most recent report. Yields were raised slightly in most other states. North Dakota had the biggest increase of 6.2% or 8 bu/acre. Nebraska and Virginia were tied with the largest drop in terms of percentage with 3.8% declines in yields. This equated to a drop of 7 bu/acre in Nebraska and 6 bu/acre in Virgina.
There were more states that saw yield decreases or no change for soybean yield estimates. Most upper Midwest states, including Iowa, saw no change or a slight decrease in expected yields. Kansas, Oklahoma, and Louisiana saw larger percentage decreases in soybean yields. All three states had forecast drops of 6 bu/acre from the previous month.
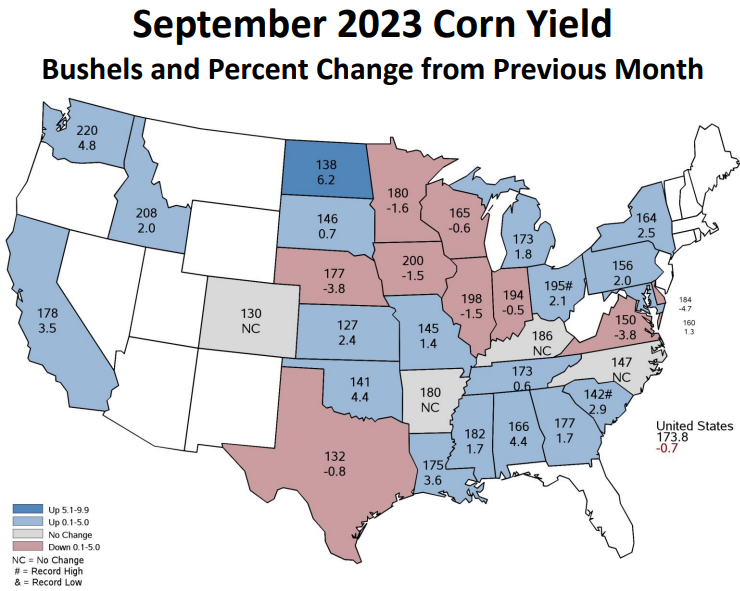
Figure 1. Sep 2023 Corn Yield, Change from Previous Month; Source: USDA-NASS Sep 2023 Crop Production Briefing
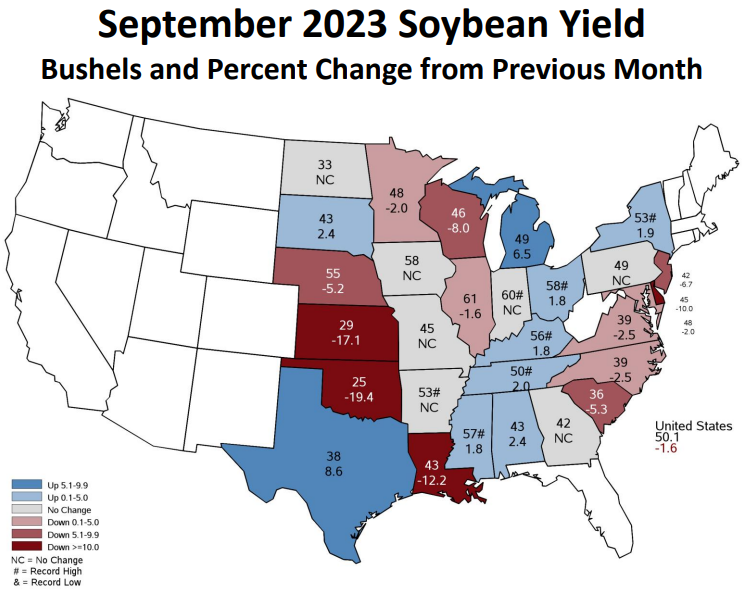
Figure 2. Sep 2023 Soybean Yield, Change from Previous Month; Source: USDA-NASS Sep 2023 Crop Production Briefing
State by state yield estimates for corn and soybeans compared to the previous year are shown in Figure 3 and Figure 4. Corn yields are expected to be up in most states. However, states in the upper Midwest including Iowa, Minnesota, Wisconsin, Illinois, and Missouri are expected to have lower or similar yields to last year. Soybean yields are also expected to be lower in upper Midwest states and higher in states outside this region.
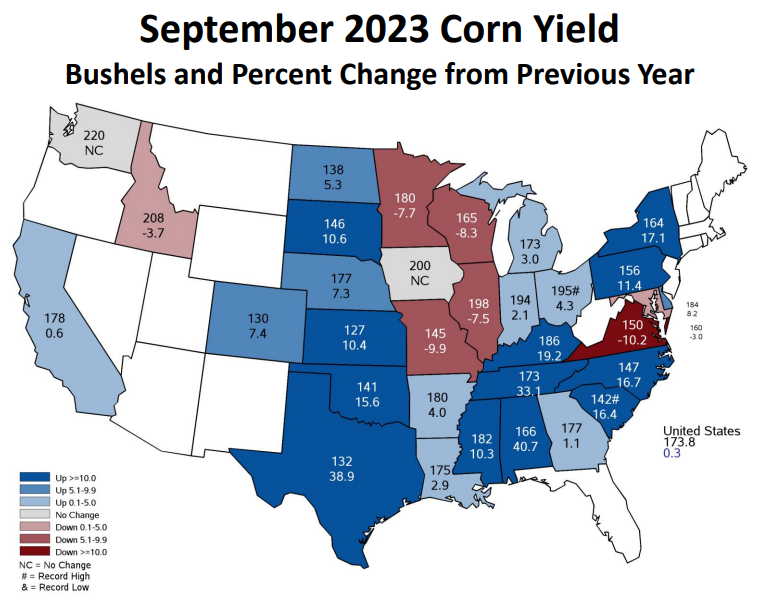
Figure 3. Sep 2023 Corn Yield, Change from Previous Year; Source: USDA-NASS Sep 2023 Crop Production Briefing
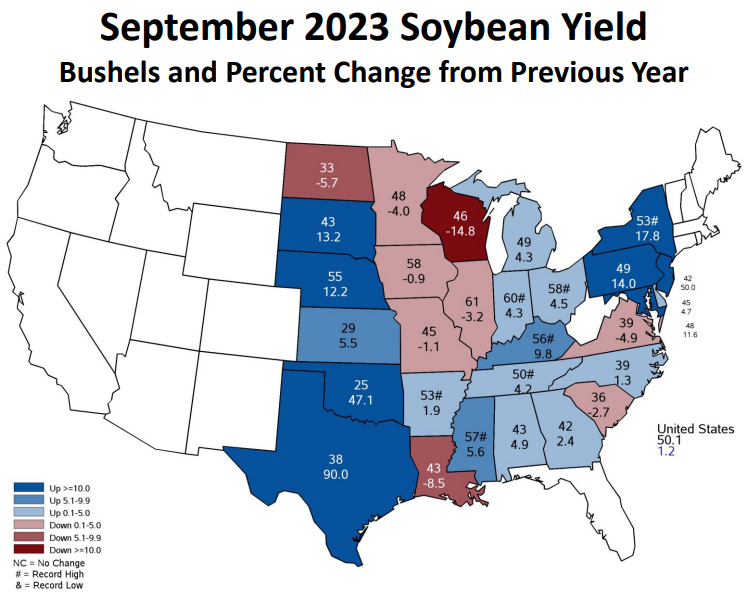
Figure 4. Sep 2023 Soybean Yield, Change from Previous Year; Source: USDA-NASS Sep 2023 Crop Production Briefing
Want more news on this topic? Farm Bureau members may subscribe for a free email news service, featuring the farm and rural topics that interest them most!