U.S. soybean exports growing in markets other than China in 2018/19
Author
Published
5/9/2019
Iowa is the number two soybean producer in the country after Illinois. In 2018/19 Iowa produced 565 million bushels of soybeans, which was about 12.4 percent of U.S. soybean production (4.544 billion bushels). U.S. soybean production is mainly destined for crush plants in the domestic market or for exports.
In 2017/18 the United State exported 48 percent of production reaching a volume of 2.129 billion bushels. Forty nine percent of those exports were shipped to China, the leading foreign market for U.S. soybeans last year. USDA projected in April 2019 that U.S. soybean exports would fall 12 percent year-over-year to 1.875 billion bushels in the 2018/19 marketing year. Exports are expected to represent 41 percent of total production. The projected decline in exports this current marketing year is primarily due to lower demand from China.
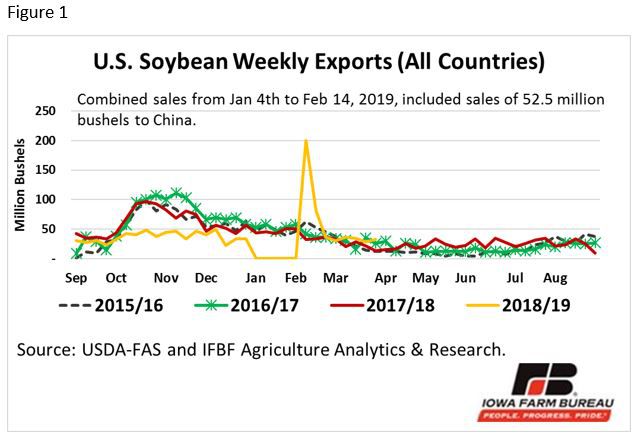
Figure 1 shows U.S. soybean weekly export sales for the last three marketing years and weekly sales during the first 31 weeks of the 2018/19 marketing year (i.e., data as of April 4, 2019). Weekly sales have substantially declined this marketing year resulting largely from lower trade with China following an additional 25 percent tariff on U.S. soybeans. The large volume of sales (200.3 million bushels) reported on February 14, 2019, represents the accumulated weekly sales during January 4th to February 14th 2019, as sales were not reported during the U.S. government shutdown.
U.S. soybean exports to China and rest of the world (ROW)
Historically, the bulk of U.S. soybean sales to China is realized during the first quarter of the marketing year and through the second quarter, following the U.S. harvest and before Brazil’s soybean harvest is in full swing. Brazil has become the number one soybean supplier to China. Figure 2 shows that U.S. soybean exports to China have been decimated due to tariffs and an emphasis on Chinese imports of Brazilian soybeans. From January 4 to February 14, 2019, the United States exported 52.5 million bushels to China; followed-up by a second large purchase of 50.8 million bushels during the following week, both occurring after December 2018 trade talks between the U.S. and China. However, those sales (103.3 million bushels) represented less than three quarters of the weekly sales during the same six-week period last marketing year (145.2 million bushels).
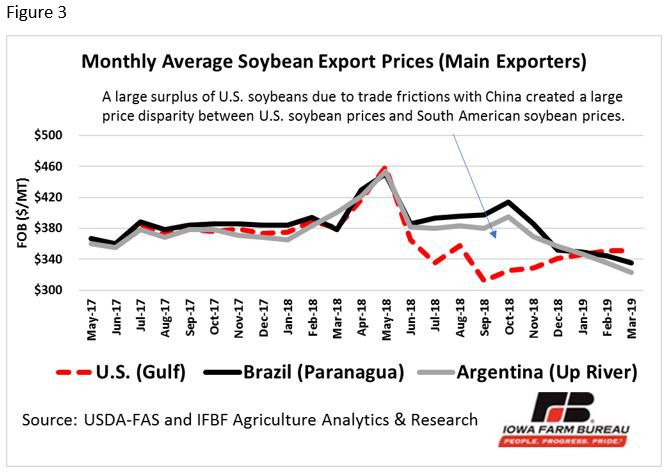
From September to December 2018, weekly U.S. soybean sales outside China averaged 36 million bushels up 87 percent from the same period the previous year (see Figure 2). Demand for U.S. soybeans in markets other than China has been driven by the large price discounts for U.S. soybeans relative to Brazil and Argentina’s soybeans. The trade dispute between the United States and China created a large surplus of U.S. soybeans. Based on USDA data from September to December 2018, the average U.S. soybean export price was $327 per metric ton (MT), representing a discount of $61 per MT relative to Brazil’s average price during that period. The price discount for U.S. soybeans compared with Brazilian soybeans was $8 per MT during September to December 2017 (see Figure 3). More recently, the gap between U.S. soybean export prices and those for South American origin soybeans has narrowed. This reflects the reopening of U.S. soybean sales to China. The U.S. soybean average price in March 2019 ($351 per MT) was $16 per MT above Brazil’s average price ($335 per MT) and $28 per MT ahead of Argentina’s average price ($323 per MT) (see Figure 3). According to USDA, other factors reducing the price spread between the United States and South America are post-harvest lows in South America and disruptions to inland shipping due to river flooding in the United States that have added to costs.
S. Patricia Batres-Marquez, Senior Research Analyst, Decision Innovation Solutions (DIS). DIS is an Iowa-based economic research firm which provides regular farm economic research for the Iowa Farm Bureau Federation.
Want more news on this topic? Farm Bureau members may subscribe for a free email news service, featuring the farm and rural topics that interest them most!