U.S. Soybean Outlook: Production, Domestic Consumption, and Exports (October 26, 2017)
Author
Published
10/26/2017
The October 2017 edition of the World Agricultural Supply and Demand Estimates (WASDE) report, published by USDA, indicated an unchanged (compared with the September forecast) 2017/18 U.S. soybean production forecast at a record level of 4.431 billion bushels. Relative to 2016/17, production is up by 135 million bushels. 2017/18 soybean yield forecast was reduced by 0.4 bushels/acre to 49.5 bushels/acre, whereas area planted and are harvested were both projected up 0.7 million acres to 90.2 million acres and 0.8 million acres to a record level of 89.5 million acres, respectively. As reported by USDA, acreage certified by farmers enrolled in commodity programs confirmed a higher level of soybean planting this year than previously estimated.
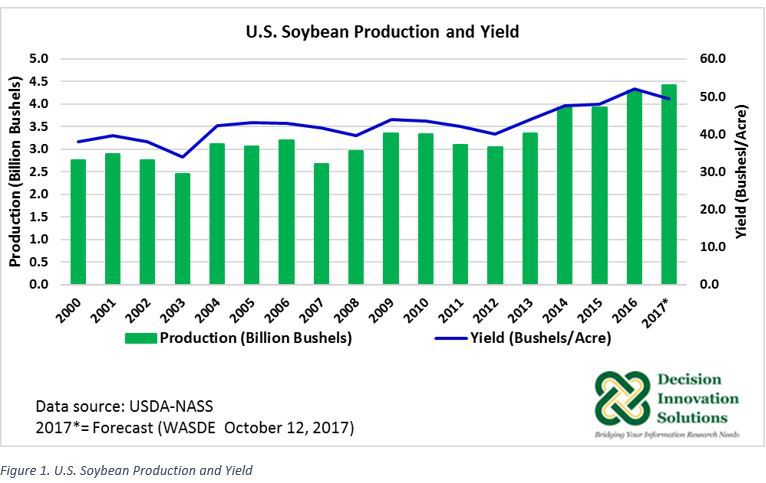
2017/18 soybean supplies were projected down 44 million bushels to 4.757 billion bushels compared with last month’s projection. Supplies were down as a result of reduced 2017/18 beginning stocks (2016/17 ending stocks) estimated at 301 million bushels. Based on USDA-NASS Grain Stocks report published on September 29, 2017, old crop soybeans (2016/17) stored in all positions on September 1, 2017, totaled 301 million bushels instead of 345 million bushels, the September 12, 2017, WASDE report estimate for 2016/17 ending stocks.
The forecasts for crushing (1.940 billion bushels), exports (2.250 billion bushels), seed (101 million bushels), and residual (35 million bushels) for the 2017/18 marketing year remained the same level as their corresponding September forecasts. With no changes in any of the components of the soybean demand side, ending stocks were forecast at 430 million bushels via the reduction in beginning stocks.
U.S. Soybean Exports: First Seven Weeks of the 2017/18 Marketing Year
The U.S. export sales published by USDA-Foreign Agricultural Service (FAS) on October 26, 2017 are based on reports from exporters for weekly exports during the October 13 to 19, 2017 period. The report indicates net[1] soybean sales of 78.239 million bushels (2.129 million metric tons) were up 67 percent from the previous week (48.854 million bushels). Weekly export[2] sales during the 7th week of the 2017/18 marketing year (92.690 million bushels) rose 36 percent compared with the previous week (67.976 million bushels). As Figure 2 indicates, accumulated[3] exports sales during the first seven weeks of the 2017/18 marketing year (351 million bushels) were up 129 million bushels and 72 million bushels compared with the same period during the 2015/16 and 2016/17 marketing years, respectively.
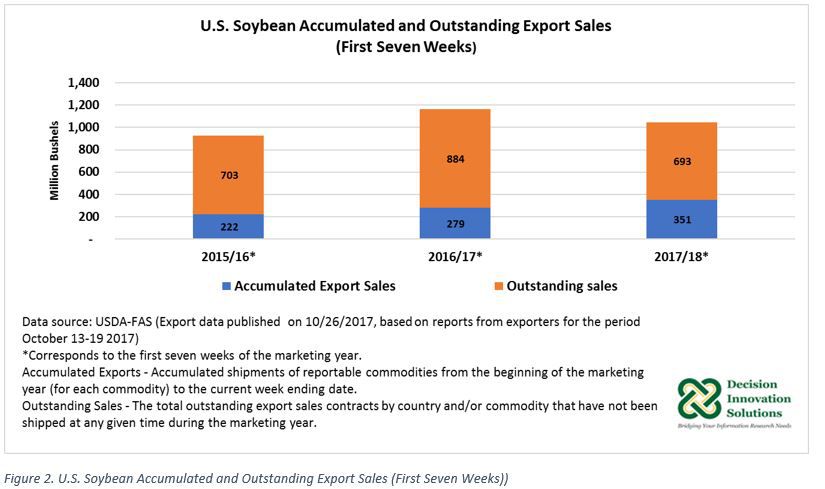
Total commitments[4] by October 19, 2017 were up 8 percent to 1,044 million bushels relative to the previous week (966 million bushels), with 351 million bushels from accumulated export and 693 million bushels in outstanding[5] sales (see Figure 2). Total commitments during the first seven weeks of the 2017/18 marketing year were down 10 percent compared with the same period in the 2016/17 marketing year (1,163 million bushels). Accumulated exports during the first seven weeks of the 2017/18 marketing year (351 million bushels) were up 26 percent year over year (279 million bushels), whereas outstanding sales (693 million bushels) were down 22 percent relative to the first seven weeks of the 2016/17 marketing year (884 million bushels).
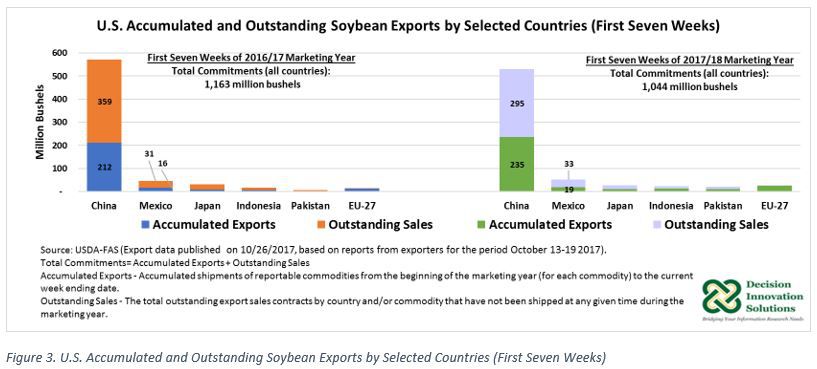
China is the largest export market for U.S. soybeans. China’s total commitment as of October 19, 2017, equaled 531 million bushels with 235 million bushels in accumulated sales and 295 million bushels in outstanding sales (see Figure 3). At this rate, China’s total commitments made up 50.8 percent of total commitments from all countries (1,044 million bushels). So far (first seven weeks of the 2017/18 marketing year), China’s total commitments are behind by 41 million bushels from total commitments during the same period last year (571 million bushels). China’s accumulated sales during the first seven weeks of the current marketing year are larger by 23 million bushels year over year (212 million bushels) but lower outstanding sales compared with last year (359 million bushels) offset total China total commitments during this first seven weeks of the 2017/18 (see Figure 3).
A distant second largest market for U.S. soybeans is Mexico. During the first seven weeks of the current marketing year, Mexico’s total commitments increased by 6 million bushels to 52 million bushels compared with the same period last marketing year (46 million bushels). Mexico’s total commitments as of October 19, 2017, include 19 million bushels in accumulated export sales and 33 million bushels in outstanding sales (see Figure 3).
The October WASDE forecast for 2017/18 soybean exports remained unchanged from last month’s projection (2.250 billion bushels), but if realized it would be up 16 percent and 3 percent relative to the volumes exported in 2015/16 and 2016/17, respectively.
The 2017/18 U.S. season-average soybean price forecast range is $8.35 to $10.05 per bushel (midpoint $9.20/bushel), unchanged from the September forecast.
[1] Net Sales or Net Changes - The sum total resulting from new export sales, increases resulting from changes in destination, decreases resulting from changes in destination, decreases resulting from purchases from foreign sellers, and cancellations resulting from contract adjustments, buybacks, loading tolerances, changes in marketing year, or change in commodity.
[2] Weekly Exports - Shipments of reportable commodities exported against sales for a reporting week Friday through Thursday.
[3] Accumulated Exports - Accumulated shipments of reportable commodities from the beginning of the marketing year (for each commodity) to the current week ending date.
[4] Total Commitment - The grand total of outstanding sales plus accumulated exports by country and/or commodity at any given time during the marketing year.
[5] Outstanding Sales - The total outstanding export sales contracts by country and/or commodity that have not been shipped at any given time during the marketing year.
Want more news on this topic? Farm Bureau members may subscribe for a free email news service, featuring the farm and rural topics that interest them most!