U.S. Egg Production and Exports: Recent Historical Data and Outlook
Author
Published
6/29/2017
Background
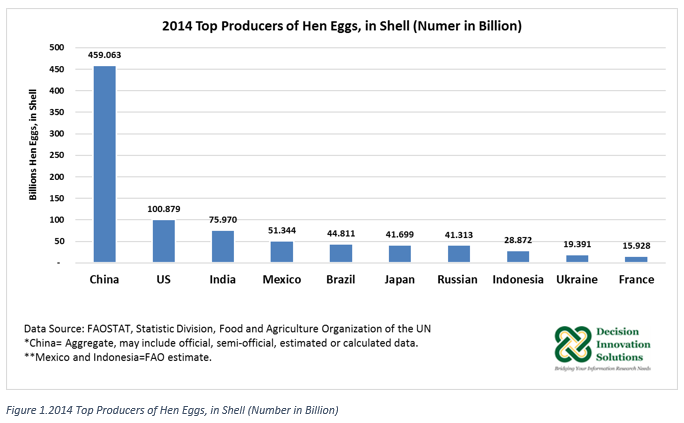
Based on the most recent data on world egg production available from FAOSTAT, Statistic Division of the Food and Agriculture Organization, in 2014 the United States was the second largest egg producer (100.879 billion eggs) after China (459.063 billion eggs) (see Figure 1). From 2007 to 2014 the United States’ share of world egg production was about 7.7%, on average, while China’s share was 39.4%, on average.
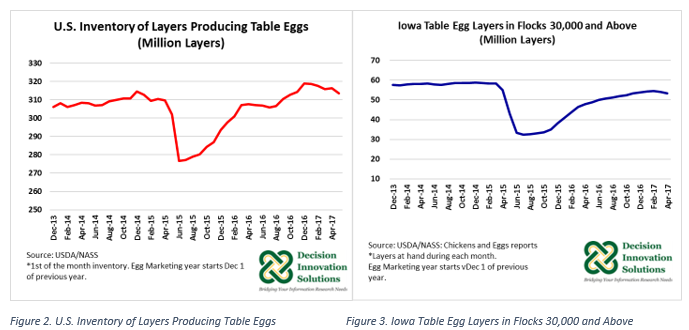
Iowa is the largest table egg producer in the United States, and in 2015 the Pathogenic Avian Influenza (HPAI) outbreak severely impacted the state’s egg industry for much of that year. As Figures 2 and 3 indicate, inventories of layer producing table eggs both at the national level and in Iowa started to slowly recover back in October 2015, but it wasn’t until May 2016 when inventories surpassed those from the same period the previous year. U.S. inventories of layers producing table eggs have recovered and surpassed pre-HPAI levels. Iowa’s number of layers in flocks 30,000 and above, on the other hand, remain below pre-HPAI levels.
Number of Layers and Egg Production
According to the Chickens and Eggs 2016 Summary report released by USDA-NASS in February 2017, there were an average of 365.336 million layers during the year ending November 2016, which was up 3.7% from 2015 (352.411 million layers). Total U.S. egg production was up 4.9% to 101.953 billion eggs compared with 97.208 billion eggs in 2015. In addition, the annual average production per layer increased by 3 eggs per layer to 279 eggs in 2016 compared with the previous year (276 per layer). More layers and increased eggs per hen contributed to the increase in egg production. Table egg production was 86.7% (88.4 billion eggs) of total egg production in 2016, with the remaining 13.3% (13.6 billion eggs) being hatching egg production. 2016 table egg production and hatching egg production increased 5.4% and 1.7%, respectively, from 2015.
Iowa’s layer numbers for marketing year starting December 2015 and ending November 2016, averaged 49.245 million, up 8.3% from 2015. Iowa’s annual average production per layer in 2016 was 276 eggs, up 2 eggs per layer (0.7%) from the previous year (274 eggs). Iowa’s 2016 egg production reached a volume of 13.608 billion eggs, increasing 9.1% year over year. On average (2008 to 2016), Iowa has produced 15.5% of total U.S. egg production and 17.7% of total U.S. table egg production. Most eggs production in Iowa consist of table eggs. From 2008 to 2016, 98.7% of Iowa’s egg production was table egg production, on average, and only 1.3% was hatching eggs.
U.S. monthly table egg production from December 2016 to April 2017 has been above the corresponding monthly production during the previous two years (for December 2016 data) and three years (for January 2017 to April 2017 data) (see Figure 4). U.S. table egg production for the first five months of the current egg marketing year (which started on December 1, 2016), increased 6.9% to 38.322 billion eggs (3.19 billion dozen) compared with the same period of the preceding marketing year.
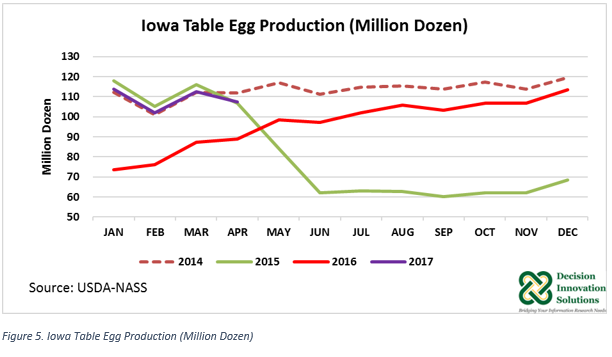
Iowa’s total table egg production from December 2016 to April 2017 reached a volume of 6.59 billion eggs (549.2 million dozen) increasing 39.3% relative to December 2015 to April 2016 (4.731 billion eggs, 394.3 million dozen) (see Figure 5).
U.S. Egg Exports
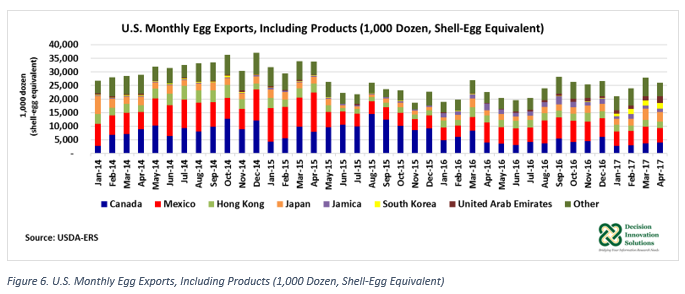
U.S. egg exports (shell eggs and egg products) during calendar year 2016 (279.25 million dozen, shell-egg equivalent) were down 10.9% from 2015 (313.58 million dozen, shell-egg equivalent). Mexico was the number one market destination for U.S. shell eggs and egg products during the 2016 calendar year (see Figure 6). Mexico imported 27% (76.496 million dozen, shell egg-equivalent) of 2016 total U.S. exports. Also included in the top five destinations for U.S. egg exports in 2016 were Canada (58.313 million dozen, shell egg-equivalent, 21%), Hong Kong (33.087 million dozen, shell-egg equivalent, 12%), Japan (25.359 million dozen, shell-egg equivalent, 9.0%), and Jamaica (22.028 million dozen, shell-egg equivalent, 8.0%). 2016 U.S. egg exports to Mexico and Canada were down 12% and 48%, respectively, year over year. However, exports to the other top destinations were up in 2016 relative to 2015, with exports to Jamaica increasing the most (286%). Exports to Japan and Hong Kong rose 16% and 21%, correspondingly. U.S. shell eggs and egg products were exported to 87 countries in 2016.
January to April 2017 egg and egg product exports were 98.792 million dozen (shell-egg equivalent), up 11.7% from the same period last year (88.408 million dozen, shell equivalent). Mexico continued as the main destination for U.S. egg exports and egg products with 22% (22.112 million dozen, shell-egg equivalent) of total exports. January to April 2017 exports to Mexico rose 5% year over year. Other countries showing an increase in imports of U.S. eggs and egg products during the first four months of 2017 were Japan (12.405 million dozen, shell-egg equivalent), South Korea (6.836 million dozen, shell-egg equivalent), and United Arab Emirates (6.528 million dozen, shell-egg equivalent). Japan and South Korea exports consisted mainly of processed egg products. Exports to Canada declined 42% to 13.436 million dozen (shell-egg equivalent) during this period from 2016 (January to April). Overall, U.S. egg and egg products have been shipped to 77 foreign markets during the first four months of 2017.
2017 and 2018 Outlook
U.S. total egg production (hatching plus table egg production) forecast for the 2017 calendar year, published by the USDA in the June 2017 World Agricultural Supply and Demand Estimate (WASDE), is 8.749 billion dozen (104.988 billion eggs), up 2.1% from 2016 levels. The forecast for 2018 indicates a continuation of this upward trend as U.S. egg production is expected to increase 1.6% to 8.890 billion dozen from the 2017 projection.
U.S. egg exports are also expected to increase in 2017 and 2018 from their corresponding previous years. The USDA forecasts (WASDE June 2017) for 2017 and 2018 are 302.8 million dozen and 320.0 million dozen, respectively. 2017 forecast is up 8.5% year over year, whereas the 2018 projection is up 5.7% from the 2017 expected level.
Based on data from USDA published in the June 2017 WASDE report, in 2015, 3.9% of U.S. egg production was exported. That share declined to 3.3% in 2016. The export share of production is expected at 3.5% and 3.6% in 2017 and 2018, respectively.
Want more news on this topic? Farm Bureau members may subscribe for a free email news service, featuring the farm and rural topics that interest them most!