U.S. Corn Exports Update: First Seven Weeks of the 2017/18 Marketing Year
Author
Published
10/31/2017
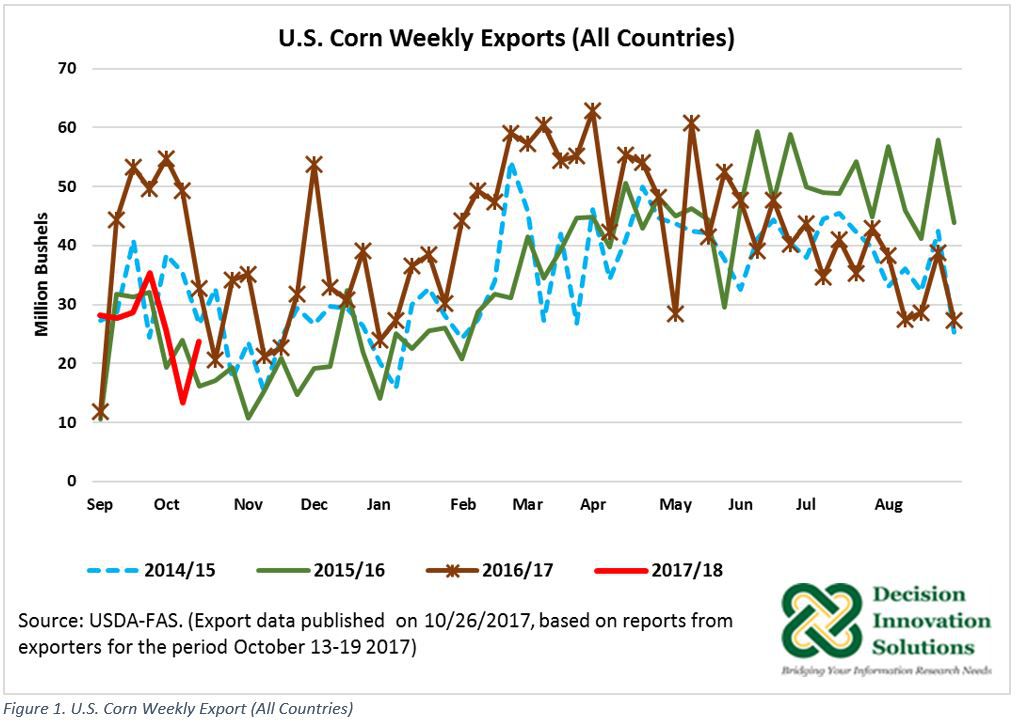
The latest U.S. export sales published by USDA-Foreign Agricultural Service (FAS) on October 26, 2017, indicates weekly net corn exports sales were equal to 50.72 million bushels (1.288 million metric tons) during the October 13 to 19, 2017 period. Net corn exports[1] were up 2.7 percent from the previous week (49.4 million bushels) and 32 percent from the previous 4-week average (38.38 million bushels). Weekly export sales[2] during the 7th week of the 2017/18 marketing year (23.79 million bushels) increased 78.1 percent compared with the previous week (13.36 million bushels) (see Figure 1). As Figure 1 indicates, since the beginning of the current marketing year to October 19, 2017, weekly export sales have been outpaced by most weekly sales during previous marketing years.
Acumulated[3] corn exports during the first seven weeks of the 2017/18 marketing year (183 million bushels) were down 38 percent year over year (296 million bushels), whereas outstanding sales[4] (456 million bushels) were down 23 percent relative to the first seven weeks of the 2016/17 marketing year (589 million bushels) (see Figure 2). With this level of accumulated exports and outstanding sales, total commitments[5] by October 19, 2017 were up 8.6 percent to 638 million bushels relative to the previous week (588 million bushels). Total commitments during the first seven weeks of the 2017/18 marketing year were down by 246 million bushels (28 percent) compared with the same period in the 2016/17 marketing year (885 million bushels) but 171 million bushels (37 percent) ahead when compared with total commitment during the first seven weeks of the 2015/16 marketing (468 million bushels).

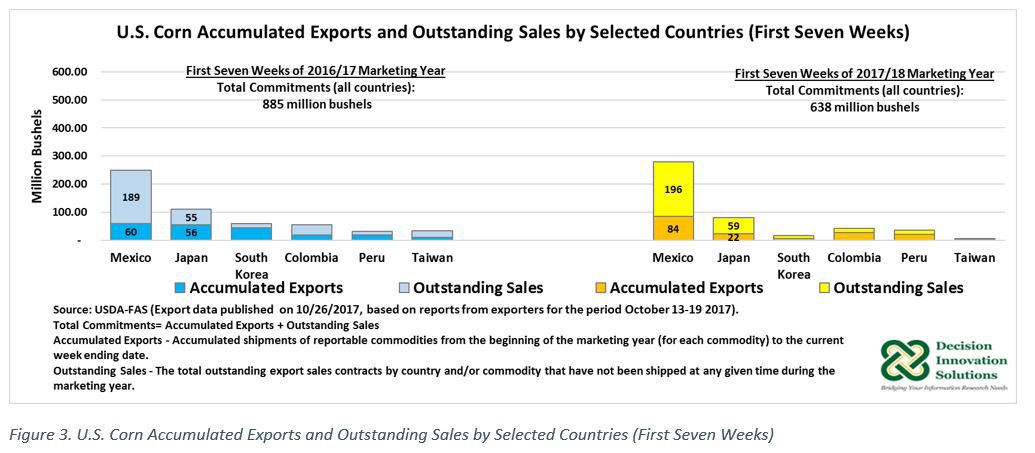
As Figure 3 indicates, Mexico is the main export market for U.S. corn. Mexico’s total commitment as of October 19, 2017, reached a volume of 280 million bushels with 84 million bushels in accumulated sales and 196 million bushels in outstanding sales. Mexico’s total commitments made up 44 percent of total commitments from all countries (638 million bushels). During the first seven weeks of the 2017/18 marketing year), Mexico’s total commitments were ahead by 31 million bushels compared with total commitments during the same period last year (250 million bushels). Mexico’s accumulated sales during the first seven weeks of the 2017/18 marketing year were up 40 percent compared with the same period of the previous year (60 million bushels). In addition, outstanding sales were larger by 7 million bushels compared with last year (189 million bushels) (see Figure 3).
Another important market for U.S. corn is Japan; however, during the first seven weeks of the current marketing year, Japan’s total commitments declined by 29 million bushels (27 percent) to 81 million bushels compared with the same period last marketing year (110 million bushels). Japan’s total commitments as of October 19, 2017, consisted of 22 million bushels in accumulated exports and 59 million bushels in outstanding sales (see Figure 3).
Based on USDA’s World Agricultural Supply and Demand Estimates (WASDE, October 12, 2017), the October forecast for 2017/18 corn exports equaled 1.850 billion bushels. This forecast indicates a reduction of 443 million bushels from the 2016/17 estimate (2.293 million bushels). Increased competitiveness of supplies in Argentina and Brazil and a low volume of new-crop outstanding sales are the reason behind this lower 2017/18 corn export forecast. If this export forecast is realized, the share of export to total production would decline to 13 percent compared with 15 percent and 14 percent, the share in 2015/16 and 2016/17, respectively.
[1] Net Sales or Net Changes - The sum total resulting from new export sales, increases resulting from changes in destination, decreases resulting from changes in destination, decreases resulting from purchases from foreign sellers, and cancellations resulting from contract adjustments, buybacks, loading tolerances, changes in marketing year, or change in commodity.
[2] Weekly Exports - Shipments of reportable commodities exported against sales for a reporting week Friday through Thursday.
[3] Accumulated Exports - Accumulated shipments of reportable commodities from the beginning of the marketing year (for each commodity) to the current week ending date.
[4]Outstanding Sales - The total outstanding export sales contracts by country and/or commodity that have not been shipped at any given time during the marketing year.
[5] Total Commitment - The grand total of outstanding sales plus accumulated exports by country and/or commodity at any given time during the marketing year.
Want more news on this topic? Farm Bureau members may subscribe for a free email news service, featuring the farm and rural topics that interest them most!