Trends in U.S. Agricultural and Related Products Trade
Author
Published
5/17/2023
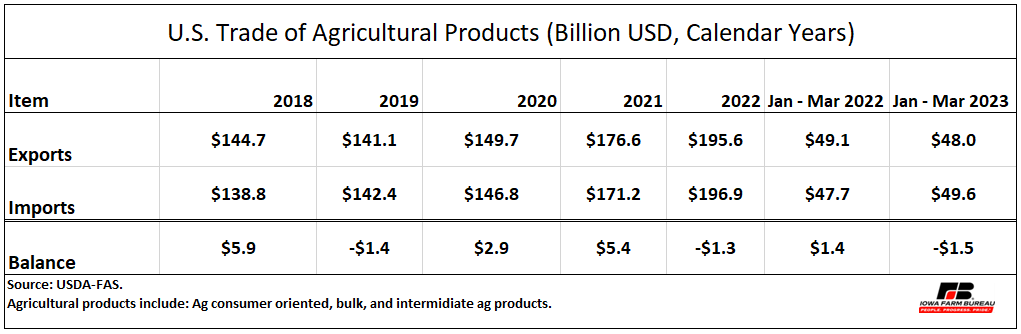
From 2018 to 2022 calendar years, the value of U.S exports of agricultural products fluctuated from $141.1 billion in 2019 to $195.6 billion in 2022. Trade data during that period indicates the U.S. trade balance (exports minus imports) of agricultural products varied from positive $5.9 billion in 2018 to a negative value of $1.4 billion in 2019. Despite the year-over-year 10.8% increase in exports in 2022, the U.S. agricultural products trade balance was still negative at $1.3 billion.
U.S. imports of agricultural products in 2023 increased 15.0% to $196.9 billion compared with the previous year ($171.2 billion). Data from January to March 2023 shows the trade balance was negative at $1.5 billion compared with a positive balance of $1.4 billion in the same time period in the previous year (see Table 1).
Table 1.U.S. Trade of Agricultural Products (Billion USD, Calendar Year)
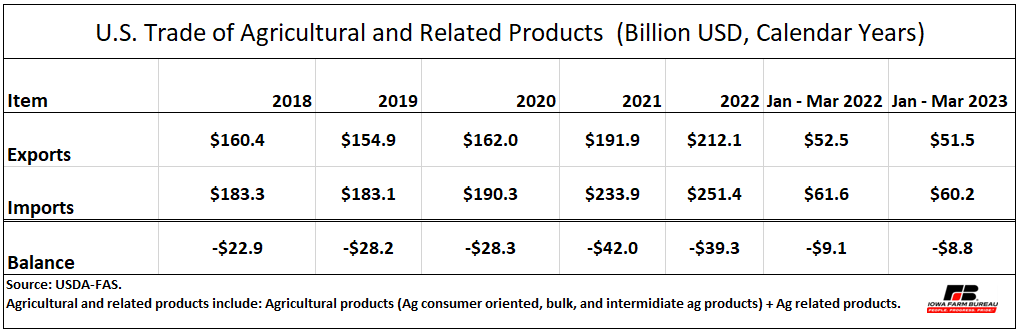
U.S. agricultural commodities include agricultural consumer-oriented products (e.g., fresh fruits and vegetables, alcoholic beverages, and bakery goods), bulk agricultural commodities (e.g., soybeans, corn, and wheat), and intermediate agricultural products (e.g., soybean meal, DDGs, and ethanol including beverages). And when adding agricultural related products (which include forest products, seafood products, and biodiesel and blends products) to agricultural commodities, the trade balance is negative from 2018 through March 2023 (see Table 2).
Table 2. U.S. Trade of Agricultural and Related Products (Billion USD, Calendar Years)
Top 10 Markets for U.S. Ag Exports
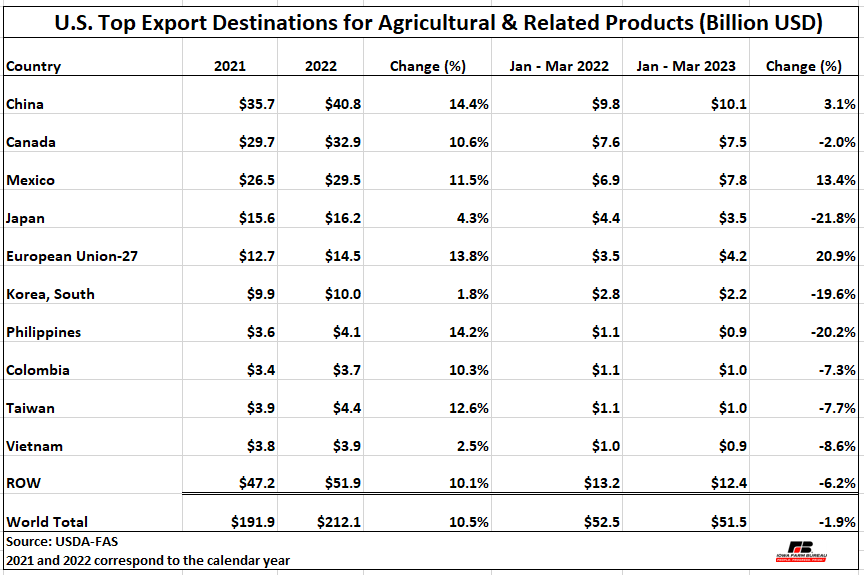
Table 3 shows the top ten markets for U.S. exports of agricultural & related products from 2021 to March 2023. The number one destination was China with a share of 19.2% (40.8 billion) of total U.S. exports in 2022. The value of U.S. exports to China increased 14.4% year-over-year. The value of U.S. exports to Canada ($32.9 billion), Mexico ($29.5 billion), Japan ($16.2 billion), and the European Union including 27 countries (EU-27) ($14.5 billion), accounted for 43.9% of total U.S. exports of agricultural & related products in 2022.
Overall, from January to March 2023, U.S. exports of agricultural & related products declined 1.9% to $51.5 billion relative to the same period in 2022. Except for China, Mexico and the EU-27, U.S. exports of agricultural & related products to top destinations experienced decline (see Table 3).
Table 3. U.S. Top Export Destinations for Agricultural & Related Products (Billion USD)
Bulk Agricultural Commodities
As Figure 1 shows, overall, the U.S. is a net exporter[1] of bulk agricultural products. In 2022 for each dollar the U.S. exported in bulk commodities, only $0.19 were spent on imports of bulk commodities. That relationship dropped to $0.18 during the first quarter of 2023.
The U.S. export value of bulk agricultural products consistently increased from $44.0 billion in 2019 to $77.3 billion in 2022. Within this group, the top U.S. export commodities are soybeans, corn, cotton, wheat, and other coarse grains (excluding corn). In 2022, these five commodities made up 94.3% of the value of total agricultural bulk products exported, with soybeans accounting for 44.5% ($34.4 billion) of total exports in this group. Corn, cotton, and wheat accounted for 24.2% ($18.7 billion), 11.7% ($9.0 billion), and 11.0% ($8.5 billion), respectively.
The U.S. export value of bulk agricultural commodities was up 17.5% (to $77.3 billion) in 2022 relative to the previous year ($65.8 billion), with higher prices playing a major role as volumes of commodities such as corn and wheat dropped from the previous year. Year-over-year, the volumes of U.S. corn and U.S. wheat exported in 2022 were down by 11.3 million MT (to 58.0 million MT) and down 3.1 million MT (20.8 million MT). In contrast, the volume of U.S. soybeans exported in 2022 increased by 4.3 million MT to 57.2 million MT. The 2022 value per MT of corn ($322.7/MT), soybeans ($601.1/MT), and wheat ($407.0/MT) were all up from the previous year by 19.4%, 16.0%, and 34.7% correspondingly.
The top five destinations for U.S. bulk agricultural products are China, Mexico, Japan, Canada, and the EU-27. In 2022, U.S. exports to these five countries accounted for 67.5% ($52.1 billion) of total U.S. bulk agricultural exports. The countries with the largest share were China (36.9%), Mexico (14.7%), and Japan (8.0%).
January to March 2023 data indicates that U.S. exports of bulk agricultural products fell 2.1% to $19.7 billion compared with the same period the previous year (see Figure 2 and Table 4). Among the top commodities in this group, U.S. soybean exports was up 37.8% to $10.5 billion, with exports to top destination, China, showing an increase of 65.0% to $6.2 billion. However, U.S. corn exports declined 35.4% to $3.7 billion during the first three months of 2023. The volume of U.S. corn exports fell 41.6% to 11.4 million MT. Except for Mexico, U.S. corn exports to other destinations shrank during January to March 2023. Despite U.S. corn competitive prices from January to the beginning of March, relative to major competitors (Brazil and Argentina), the pace of U.S. corn exports did not accelerate.
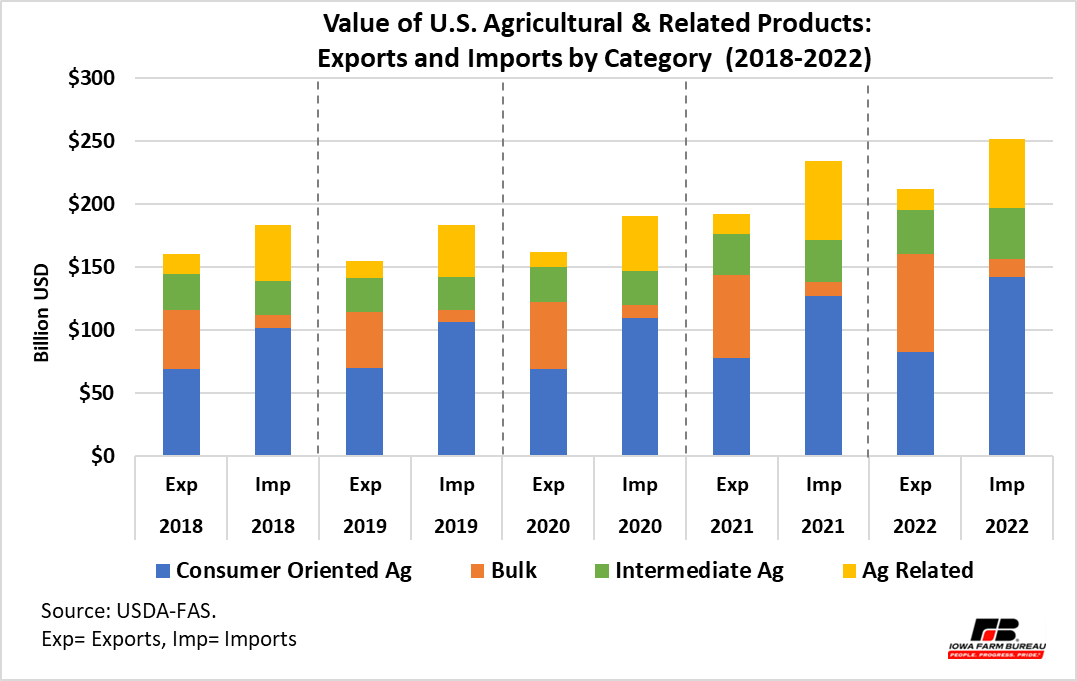
Figure 1. Value of U.S. Agricultural & Related Products: Exports and Imports by Category (2018-2022)
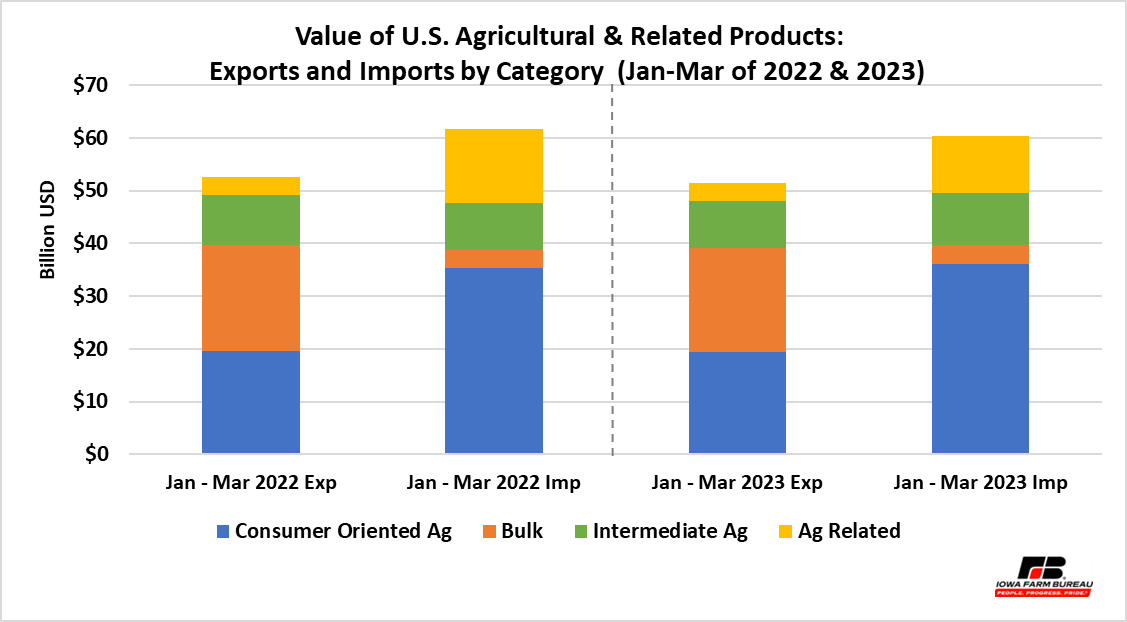
Figure 2. Value of U.S. Agricultural & Related Products: Exports and Imports by Category (Jan-Mar of 2022 & 2023)
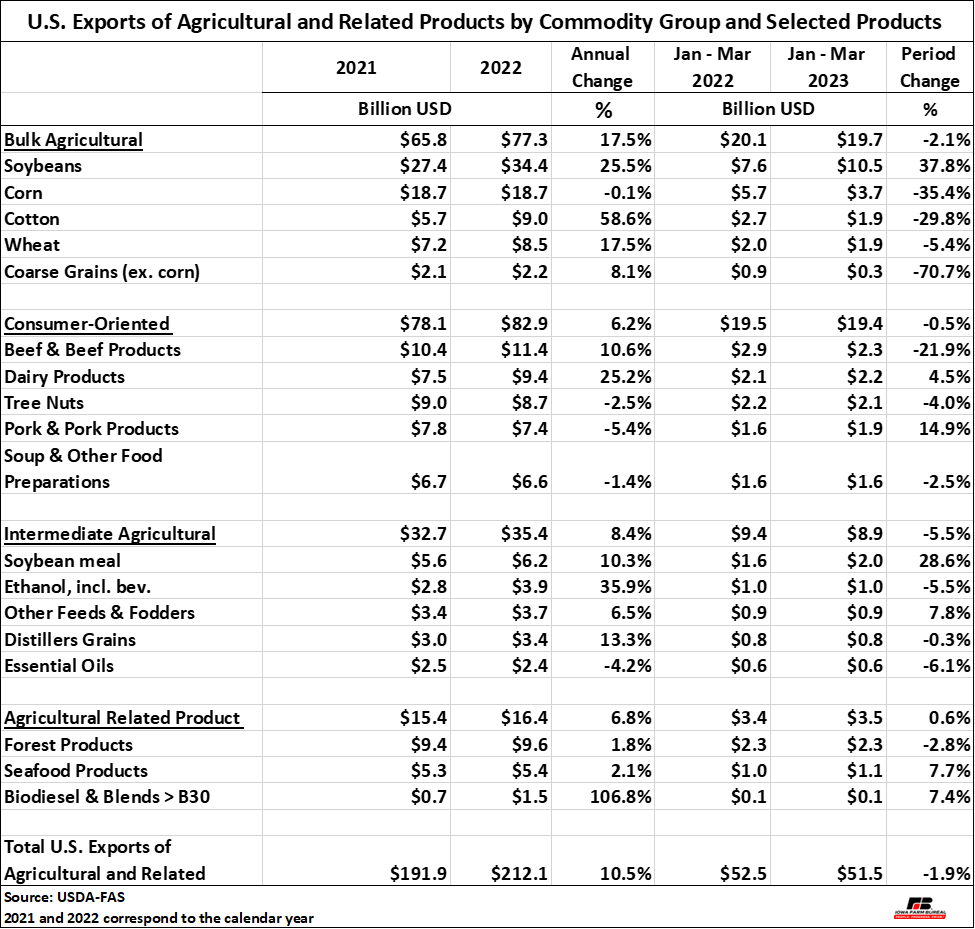
Table 4. U.S. Agricultural Exports of Agricultural and Related Products by Commodity Groups and Selected Products (Billion USD)
Consumer oriented products
The value of U.S. exports of consumer-oriented products reached to $82.9 billion in calendar year 2022, which was up 6.2% year-over-year. The top five value consumer-oriented products include beef & beef products, dairy products, tree nuts, pork & pork products, and soup & other food preparations. U.S. exports of beef & beef products and dairy products were up 10.6% (to $11.4 billion) and 25.2% (to $9.4 billion) in 2022, respectively, whereas exports of pork and pork products declined 5.4% (to $7.4 billion) (see Table 4). The volume of U.S. beef & beef product exports in 2022 reached a record high of 1.4 million MT. On the other hand, the export volume of U.S. pork & pork products dropped 8.5% to 2.6 million MT; however, the tonnage exported in 2022 was the third largest volume of U.S. pork & pork products exported over the last five years. The leading markets for U.S. consumer oriented agricultural products are Canada, Mexico, China, Japan, South Korea, and EU-27.
Data for the first trimester of 2023 indicates the value of U.S. exports of consumer oriented agricultural products fell about 0.5% to $19.5 billion relative to the same period in 2022 (see Table 4). U.S. exports of beef & beef products were down 21.9% in value (to $2.3 billion) and down 7.1% in volume (to 312,267 MT) during the first three months of 2023. As indicated by the U.S. Meat Export Federation, large beef inventories in some important markets by the end of 2022 had a negative impact on the pace of U.S. beef & beef product exports at the beginning of this year. In contrast, U.S. pork & product exports during the first trimester of 2023 increased 14.9% to $1.9 billion, with U.S. pork & product export volume up 13.3% to 701,075 MT year-over-year. The value of U.S. pork & pork product exports to key markets such as Mexico, China, and Canada expanded 33.2% (to $524.7 million), China 30.4% ($303.8 million), and 1.9% ($210 million). Note that U.S. pork exports to the second-largest market, Japan, and to the fifth-largest destination, South Korea, remained below the value exported during January to March 2021.
In terms of trade balance, the U.S. is a net importer of consumer-oriented products (see Figure 1 and Figure 2). In 2022 the top commodities imported by the U.S. were fresh fruits, distilled spirits, bakery goods, cereals, & pasta, fresh vegetables, and beef & beef products. The main U.S. suppliers of consumer-oriented commodities are Mexico, EU-27, and Canada. In 2022 for each dollar the U.S. exported in consumer-oriented products, $1.71 were spent in imports of consumer-oriented products. That relationship increased to $1.86 during the first three months of 2023.
Intermediate agricultural commodities
The value of U.S. exports of intermediate agricultural commodities expanded 8.4% to $35.4 billion in 2022 compared with the 2021 calendar year (Table 4). Fifty four percent of the value exported in 2022 was from exports of soybean meal (17.4%, $6.2 billion), ethanol including beverages (10.9%, $3.9 billion), Other feeds & fodders (10.3%, $3.7 billion), distillers grains (9.5%, $3.4 billion), and essential oils (6.7%, $2.4 billion) (see Table 4). Overall, the key markets for U.S. intermediate agricultural commodities are Canada, Mexico, EU-27, China, and South Korea. These five markets had a share of 53.5% of total value of exports in this commodity group; however, for specific commodities such as soybean meal the main destination in 2022 was the Philippines with a 16.4% share ($1.0 billion) of U.S. soybean meal exports ($6.2 billion). The top markets for U.S. ethanol (including beverages) exports in 2022 ($3.8 billion) were Canada (39.4%, $1.5 billion), South Korea (10.9%, $422.5 million), and EU-27 (9.3%, $358.5 million), and for U.S. exports of distillers grains in 2022 ($3.4 billion), Vietnam and Indonesia were the third and fourth largest markets, after Mexico and South Korea. U.S. exports of distillers grains to Mexico made up over one fourth (21.5%, $726 million) of total value of shipments. Exports of U.S. distillers grains to South Korea, Vietnam, and Indonesia represented 11.6%, 11.5%, and 8.0% of total U.S. distillers grains exports, correspondingly, in 2022.
In 2022, the U.S. imported $40.1 billion worth of intermediate agricultural products. That value was up 21.6% from the previous year. The top commodities imported were vegetable oils (not elsewhere specified or indicated) (20%, $8.0 billion), essential oils (13.5%, $5.4 billion), other intermediate products (11.0%, $4.4 billion), and sugars and sweeteners (10.0%, $4.0 billion). The U.S. imported intermediate agricultural products mainly from Canada, EU-27, Indonesia, Mexico, and India. In 2022, the value of U.S. imports of intermediate agricultural products exceeded the value of on U.S. intermediate agricultural products by $4.7 billion, whereas during January to March 2023, the value of imports was $1.0 billion above the value of U.S. exports of intermediate agricultural products.
Agricultural related products
In 2022, the U.S. exported $16.4 billion worth of agricultural related products. Fifty-eight percent (58.3%, $9.6 billion) of total U.S. exports within this category were due to U.S. exports of forest products, followed by exports of seafood products (32.7%, $5.4 billion), and exports of biodiesel & blends higher than B30 (9.0%, $1.5billion). Canada, China, and the EU-27 are the largest markets for U.S. agricultural related products. U.S. exports increased in value 6.8% in the 2022 calendar year compared with 2021. U.S. exports during the first three months of 2023 experienced less than 1% increase to $3.5 billion year-over-year (Table 4).
The difference between U.S. exports minus U.S. imports of agricultural related products was -$38.1 billion in 2022 and -$7.214 billion during January to March 2023.
U.S. imports of seafood represented 55.1% ($30.0 billion) of total U.S. import value of agricultural related products in 2022 ($54.5 billion). The top suppliers of seafood to the U.S. are Canada, Chile, and India. Whereas U.S. imports of forest products accounted for 42.3% ($23.0 billion) of total U.S. imports within this category. Canada provided the largest value of forest products (35.4%, $8.1 billion), followed by EU-27 (15.1%, $3.5 billion). Overall, U.S. imports of agricultural related products dropped 13.1 % in 2022 to $54.5 billion and 23.7% during January to March 2023 to $10.7 billion.
Export Volume Outlook (Selected Commodities)
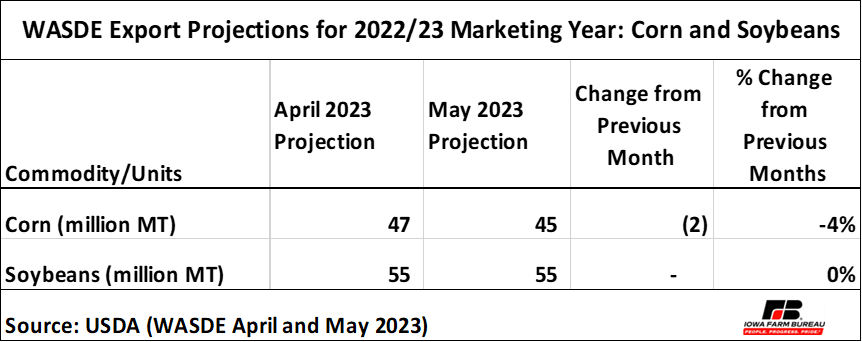
USDA’s May 2023 export volume projections (WASDE, May 2023) for U.S. corn and U.S. soybeans for the 2022/23 marketing year are presented in Table 5. Table 6 contains the May 2023 export projections for U.S. pork and U.S. beef for the 2023 calendar year.
Although projections for corn and soybeans are for the marketing year[2], they reflect the pace of exports not only during the last three month of last year but also their pace during the last four months of this year. For U.S. corn, the latest export projection has been reduced to 45 million MT, down 2.0 million MT from the previous month, and down by 4 million MT from the projection at the beginning of the year (49 million MT). For U.S. soybeans, the export projection remained unchanged from last month (55 million MT), but it is up 1 million MT from the projection in January 2023. If realized, 12.9% and 47.1% of corn and soybean production would be exported in the 2022/23 marketing year, respectively.
Table 5. WASDE Export Projections for 2022/23 Marketing Year: Corn and Soybeans
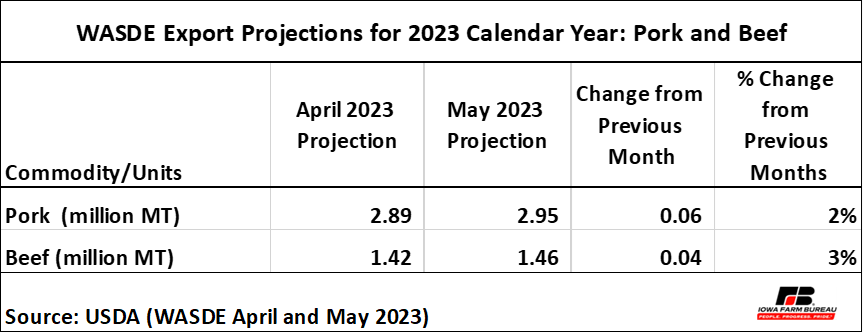
USDA May’s projections for 2022 for both U.S. pork and U.S. beef exports were upgraded from last month. U.S. pork exports are expected at 2.95 million MT, which were expanded by 55,792 MT, whereas for U.S. beef, exports are expected at 1.46 million MT, up by 40,370 MT. In January 2023 pork projection was at 2.88 MT and for beef the projection was 1.40 M. If realized, 23.7% and 11.9% of pork and beef production would be exported in the 2023 calendar year, correspondingly.
Table 6. WASDE Export Projections for 2023 Calendar Year: Pork and Beef
[1] For a net exporter country, the value of exports is higher than the value of imports.
[2] Marketing year for corn and soybeans: September-August.
Want more news on this topic? Farm Bureau members may subscribe for a free email news service, featuring the farm and rural topics that interest them most!