Trends and Variability in Farm Earnings and Non-Farm Earnings
Author
Published
12/8/2022
U.S. farm income looks to put in another strong year in 2022. The USDA is currently forecasting 2022 to be the highest net farm income year in history. Adjusting for inflation, only 1973, 2013, and 2021 would be better years if the current forecast is realized.
Record years are great, especially for income statements and financial sheets. However, those in the agricultural sector understand farming carries a substantial amount of variability and good years like 2021 and 2022 likely won’t be the norm.
We can see the variability in the farming economy by looking at some earnings data from the U.S. Bureau of Economic Analysis (BEA). Earnings for multiple industries are reported by BEA. Earnings include:
- Wages and Salaries
- Supplements to wages and salaries including employer contributions to pensions, insurance, and government social insurance
- Proprietor income
Figure 1 and Figure 2 plot these values for Iowa. Notice in Figure 1 how Iowa non-farm earnings increase at a steady rate, making the line very smooth. Quarterly farm income for Iowa (Figure 2) is much more volatile, moving up and down, sometimes by large amounts quarter-to-quarter and year-to-year.
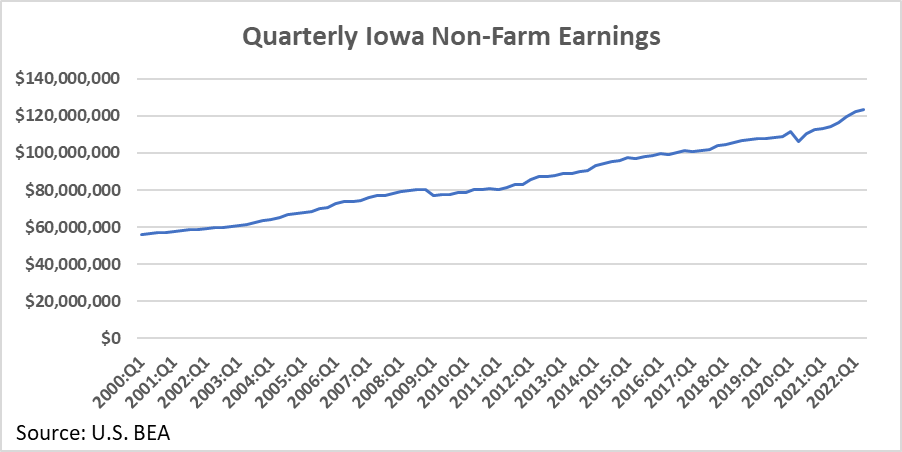
Figure 1. Quarterly Iowa Non-Farm Earnings
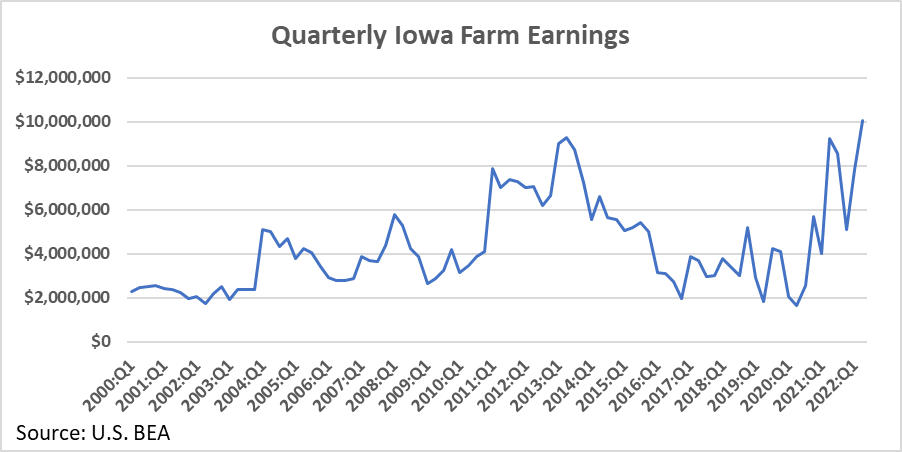
Figure 2. Quarterly Iowa Farm Earnings
Comparing farm earnings to all non-farm earnings illustrates that the farming industry contains a fair amount of variability. But using all non-farm income as a comparison is a little unfair. We would expect all non-farm income to be smoother because not all areas of the economy typically suffer at the same time. Diversification reduces variability and risk. Exceptions to this were seen in 2008-2009 and 2020 when the Great Recession and COVID-19 pandemic severely impacted the whole economy. But this is not a common occurrence. For a better understanding of the relative variability of the agricultural sector it is useful to break all non-farm income up into more industries. Fortunately, the BEA reports industry earning for a good chunk of industries in addition to farming.
To make the industry earnings data more comparable, the data is adjusted for inflation to the last quarter in the dataset (2nd quarter of 2022) and indexed to the 1st quarter of 2000. After this there are two numbers of interest in each industry: growth and variability. To illustrate what these numbers are, look at Figure 3 and Figure 4. The relative growth is measured by the slope of the trendline fitted on both figures. A steeper trendline means the industry is growing fast while a flatter trendline means the industry has limited growth. The variability is measured by how much the actual earnings move around the trendline. Note the difference between the farming industry in Figure 3, an industry with high earnings variability, and the health care and social assistance industry in Figure 4, an industry with relatively low earnings variability. Actual earnings are sometimes way above the trendline or way below the trendline in the farming industry. Meanwhile actual earnings in the health care and social assistance sector stay close to the trendline.
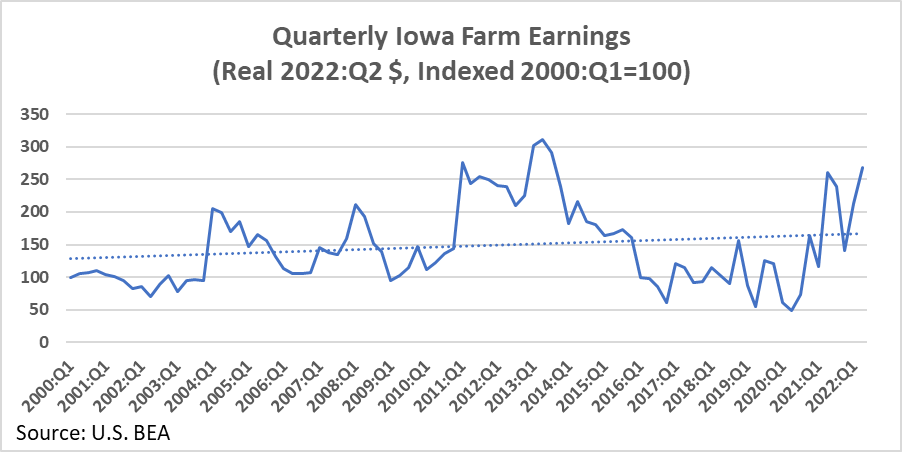
Figure 3. Quarterly Iowa Farm Industry Earnings (Real 2022:Q2 $, Indexed 2000:Q1=100)
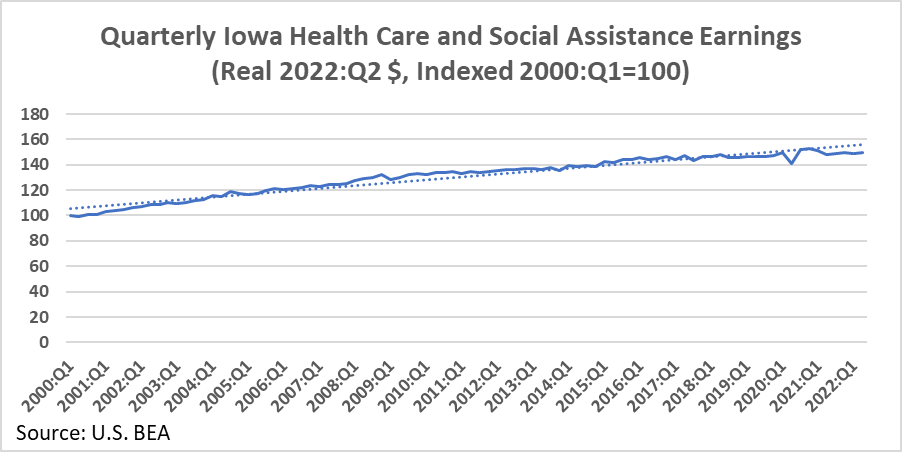
Figure 4. Quarterly Iowa Health Care and Social Assistance Industry Earnings (Real 2022:Q2 $, Indexed 2000:Q1=100)
Ideally, one would want high relative growth in earnings with relatively little variability. Some may be willing to take on high variability for the potential of faster growth or if they like undertaking risky bets that could produce high or low earnings. The relative growth and variability numbers for major Iowa industries reported by the U.S. BEA are shown in Figure 5. The data is also listed in Table 1 and Table 2. Table 1 sorts the industries by variability and Table 2 sorts the industries by relative growth.
In Iowa, the farming sector had the most variability in earnings over the period. Meanwhile its growth was near the middle of the pack, suggesting it may have a very high amount of variability for the growth is offers. Other Iowa industries that saw considerable variability in total earnings were military and real estate, though most of the variability associated with the real estate industry was due to the 2008 housing crash. Like farming, despite having high variability, the military industry earnings were also relatively low growth. However, the real estate industry showed relatively higher growth in combination with being a more variable industry. Management of companies was the sector that had the highest growth rate and exhibited a moderate variability rating. Of particular note is that all nonfarm earnings had nearly the same growth rate as farming but with the lowest variability rating of all these sectors. This again points to the fact that diversification reduces variability.
Iowa industries with relatively less variability include federal government, retail trade, and health care and social assistance. Retail trade and feral government industries both saw relatively low growth, which is expected considering they are low variability. Health care and social assistance was in the middle of the pack in terms of growth despite having limited variability.
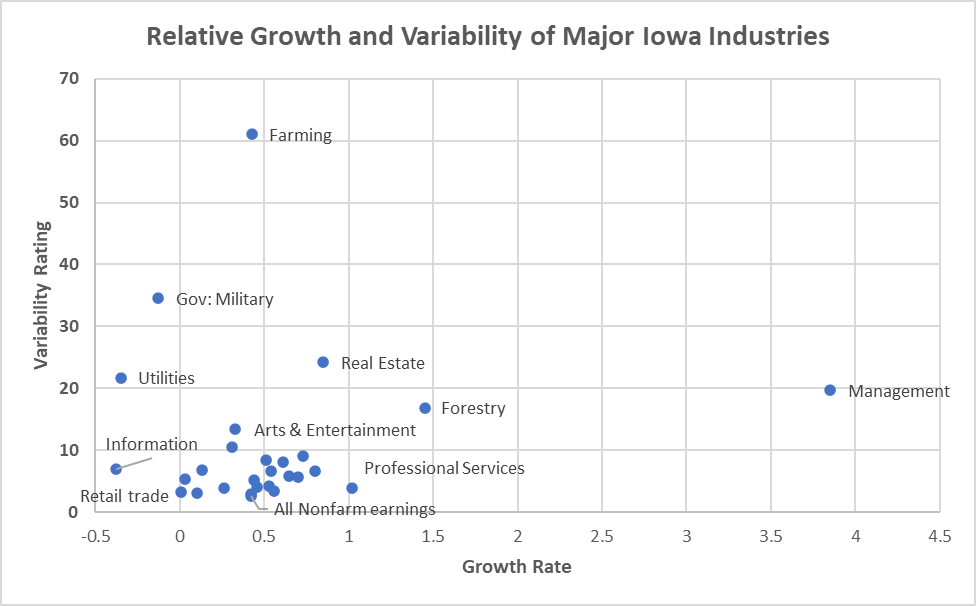
Figure 5. Relative Growth and Variability of Earnings of Major Iowa Industries
Table 1. Relative Growth and Variability of Major Iowa Industries, Sorted by Variability

Table 2. Relative Growth and Variability of Earnings of Major Iowa Industries, Sorted by Growth

The U.S. farming sector shows a similar pattern to Iowa. Figure 6 shows industry variability and growth for U.S. industries. The data is also listed in Table 3 and Table 4. The farming sector is one of the most variable sectors when looking at the whole country. The only industry at the national level with more earnings variability than the farming sector is the mining/oil sector. Like Iowa, the U.S. farming sector has relatively low growth, meaning across the U.S., the farming sector appears to carry high variability and low growth. Unlike Iowa, when looking at the U.S. the farm earnings had a lower growth rate than non-farm earnings but were also more variable.
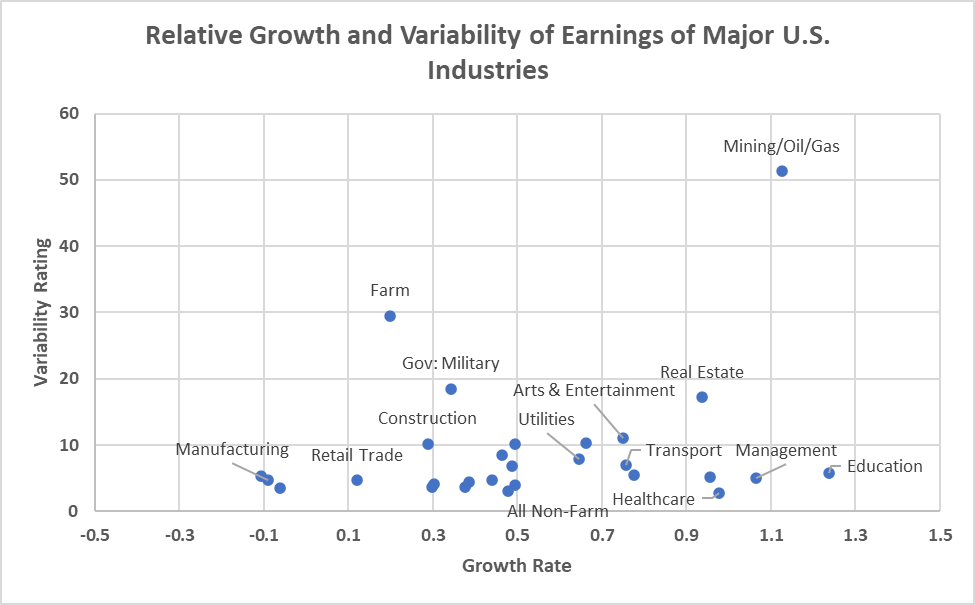
Figure 6. Relative Growth and Variability of Earnings of Major U.S. Industries
Table 3. Relative Growth and Variability of Major U.S. Industries, Sorted by Variability

Table 4. Relative Growth and Variability of Major U.S. Industries, Sorted by Growth

The Iowa farming sector is finishing up another strong year in terms of income and earnings. However, challenges including high interest rates and input costs are likely to continue into next year. The farming sector has historically been one the most variable industries in the U.S. and this trend is likely to continue moving forward.
Economic analysis provided by Aaron Gerdts, Research Analyst, Decision Innovation Solutions on behalf of Iowa Farm Bureau.
Want more news on this topic? Farm Bureau members may subscribe for a free email news service, featuring the farm and rural topics that interest them most!