Snap Shot: U.S. Ag-Trade with Japan
Author
Published
4/21/2017
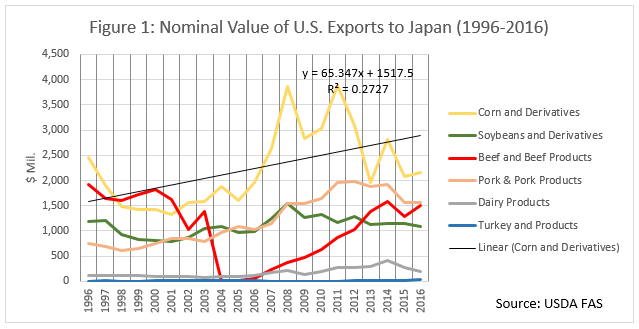
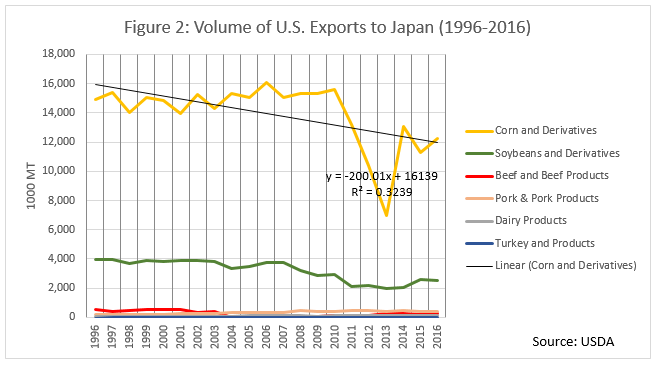
U.S. Ag-trade with Japan, although strong, has not experienced the same large increase over time that Canada, Mexico, and China have. In fact, the value of U.S. exports to Japan in the last 20 years has shown significant amounts of volatility. At the same time, because of Japan’s more strict trade policies and lack of free trade agreements with the United States a divergence in value and volume of U.S. Exports to Japan has occurred. Looking at corn specifically, it is by far the largest volume commodity, at the same time it has been decreasing in volume by 200,000 MT per year on average since 1996 (see Figure 2). Additionally, the value of corn has been increasing on average $65 million per year (see Figure 1). When this value is adjusted for inflation the increase over the 20-year period is resized to a $19 million increase.
Although there has been slightly increasing values and decreasing volumes of trade, Japan has consistently been in the top 4 or 5 export destinations for many years. This comes from a combination of Japan having a large population and a strong economy, while also having very little land to provide sustenance for this large population. On average, Japan has 872 people per square mile, whereas the United States has 84 people per square mile. Of course, both countries have a majority of their populations on the coasts and in large cities, but the number of people per square mile gives an idea of the comparative population densities and food demand.
Finally, over time, at decreased volumes the value of the various products has increased. This is congruent with economic theory; a negatively sloped demand curve, as the price of the good increases in real terms the quantity demanded decreases. Other contributions to this could include agricultural technology advances which would shift the supply curve to the right as efficiencies increase and allow for higher volumes to be produced at lower prices. However, trade economics is complicated and in this case, there are decreased volumes of agricultural products being exported even with higher efficiencies, this could be due to other countries increasing their export market share in Japan, as well as various political situations that could affect trade relations between the U.S. and Japan.
What can be drawn from this analysis? To increase trade with a country that has a large population to feed would be in the best interest of U.S. agricultural producers. Therefore, trade agreements should be pursued. The trends show increasing value of exports to Japan; trade agreements will bolster this opportunity and allow for decreased export costs to U.S. producers.
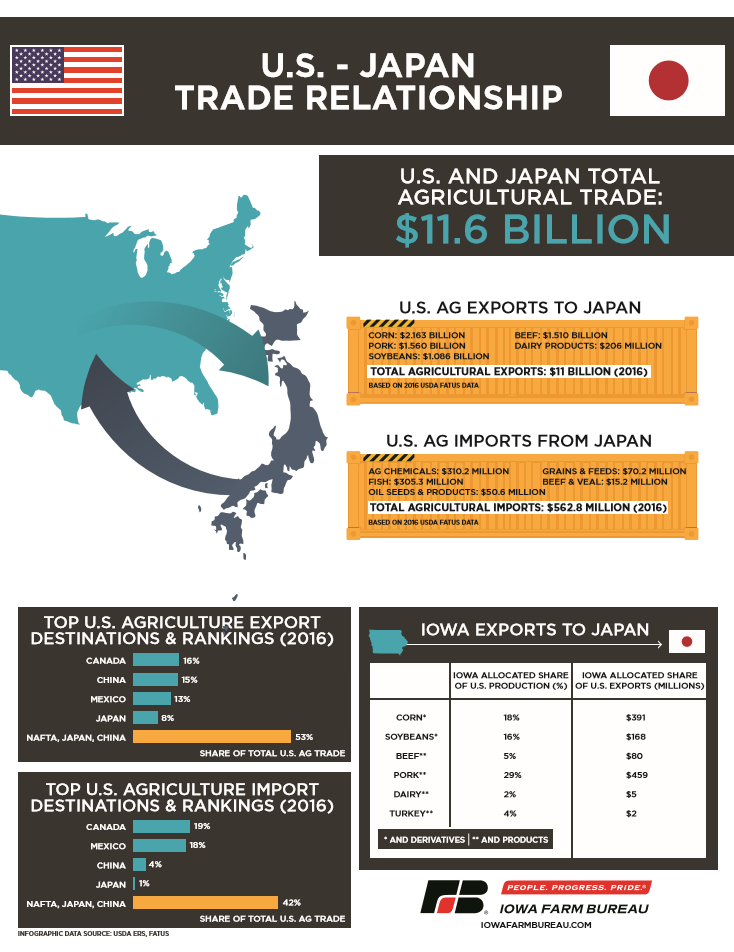
The info graphic below gives the status of trade with Japan, main commodities as well as the exports that originate in Iowa. The Iowa values are based off Iowa’s U.S. production share and then applying that to total exports of corn, soybeans, beef, pork, dairy, and turkey. These six commodities produced in Iowa make up 9.5 percent of U.S. Ag-exports to Japan.
Preston Lyman is a Research Analyst with Decision Innovation Solutions (DIS). DIS is an Iowa-Based economic research firm which provides regular farm economics research and analysis to the Iowa Farm Bureau staff and members.
Want more news on this topic? Farm Bureau members may subscribe for a free email news service, featuring the farm and rural topics that interest them most!