September Crop Report Update
Author
Published
9/14/2022
USDA’s September crop report is the first report of the year with objective, field-based observations contributing to the yield estimates for corn and soybeans. Prior to this report, yield estimates were either trendline yields or trend-yields with adjustments based on weather models. USDA estimates the Iowa corn crop at 2.49 billion bushels and the Iowa soybean crop at 591.2 million bushels (Figure 1).
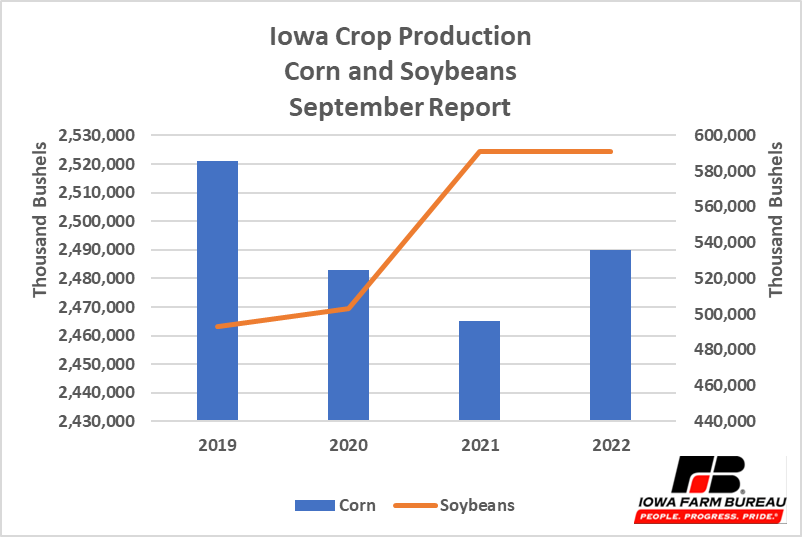
Figure 1. Iowa Crop Production, Corn and Soybeans, September Report
As a background to this report, the percent of the U.S. corn crop rated “Good to Excellent in the USDA weekly crop condition report dropped to the lowest level seen in the past 6 years with just 54% of the corn rated “Good to Excellent”. (See Figure 2.) The decline in the ratings of the U.S. corn crop in 2022 have been relatively consistent with hot, dry weather dominating a significant portion of the western corn areas. Typically, when the September corn yield declines from the August report, and the crop condition rating is ”low” then it is likely that yields in the October and beyond reports are more likely to continue declining that showing improvement.
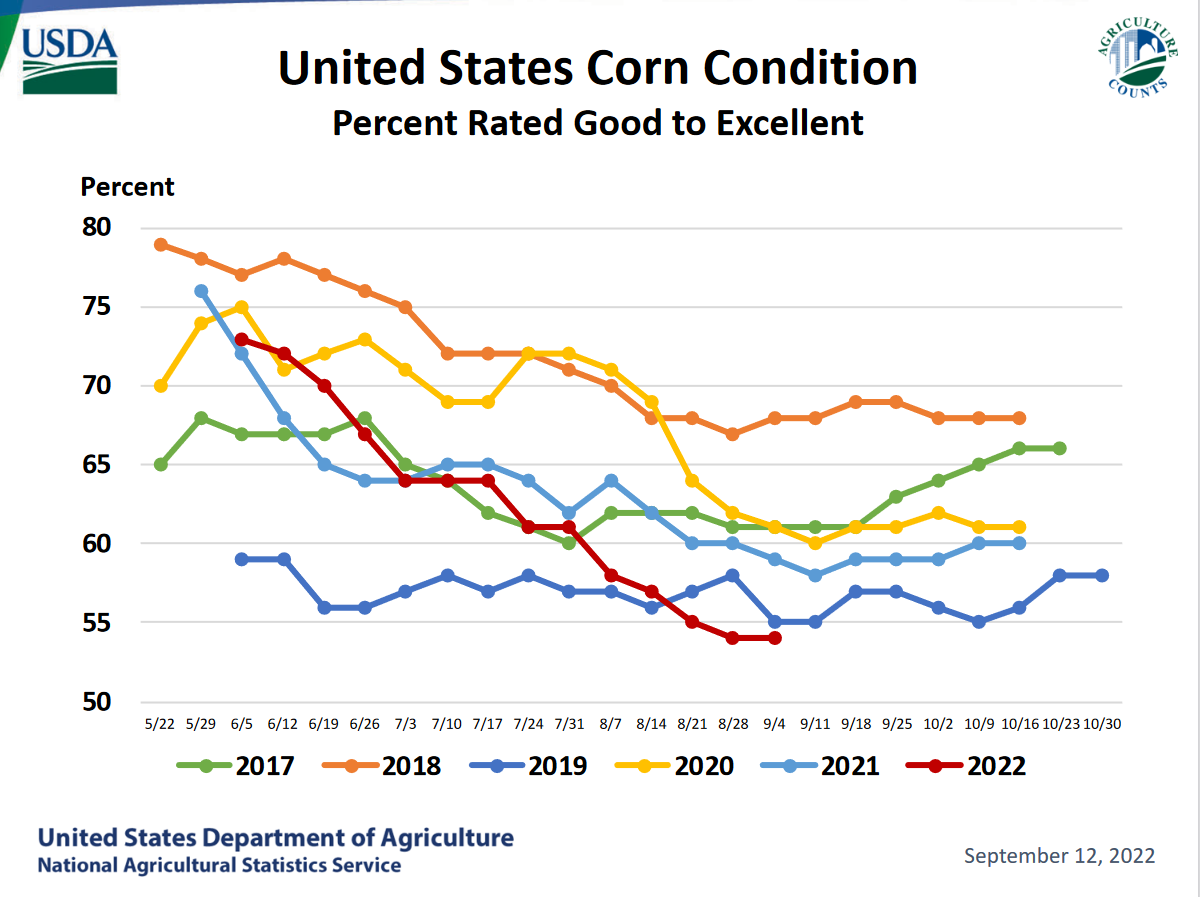
Figure 2. United States Corn Condition, Percent Rated Good to Excellent
The summary of key changes in acreage, yield and production for the 2022 corn crop are shown in Figure 3. Planted acreage was dropped 1.4% from the August report, anticipated harvested acres declined 1.2%, yield was lowered 1.7% and production was lowered 2.9% from the August report. Compared to last year, planted acreage is down 5.1%, harvested acreage is expected to be down 5.3%, yield down 2.5% and production down 7.7%.
For Iowa, there was no change in acreage from the August estimate, but the yield estimate declined 2.4%, thus production is estimated to decline 2.4% from the previous report. Other major corn producing states all had declines is estimated acreage. Yield estimates for Illinois and Minnesota increased while yield estimates for Nebraska and Indiana declined.
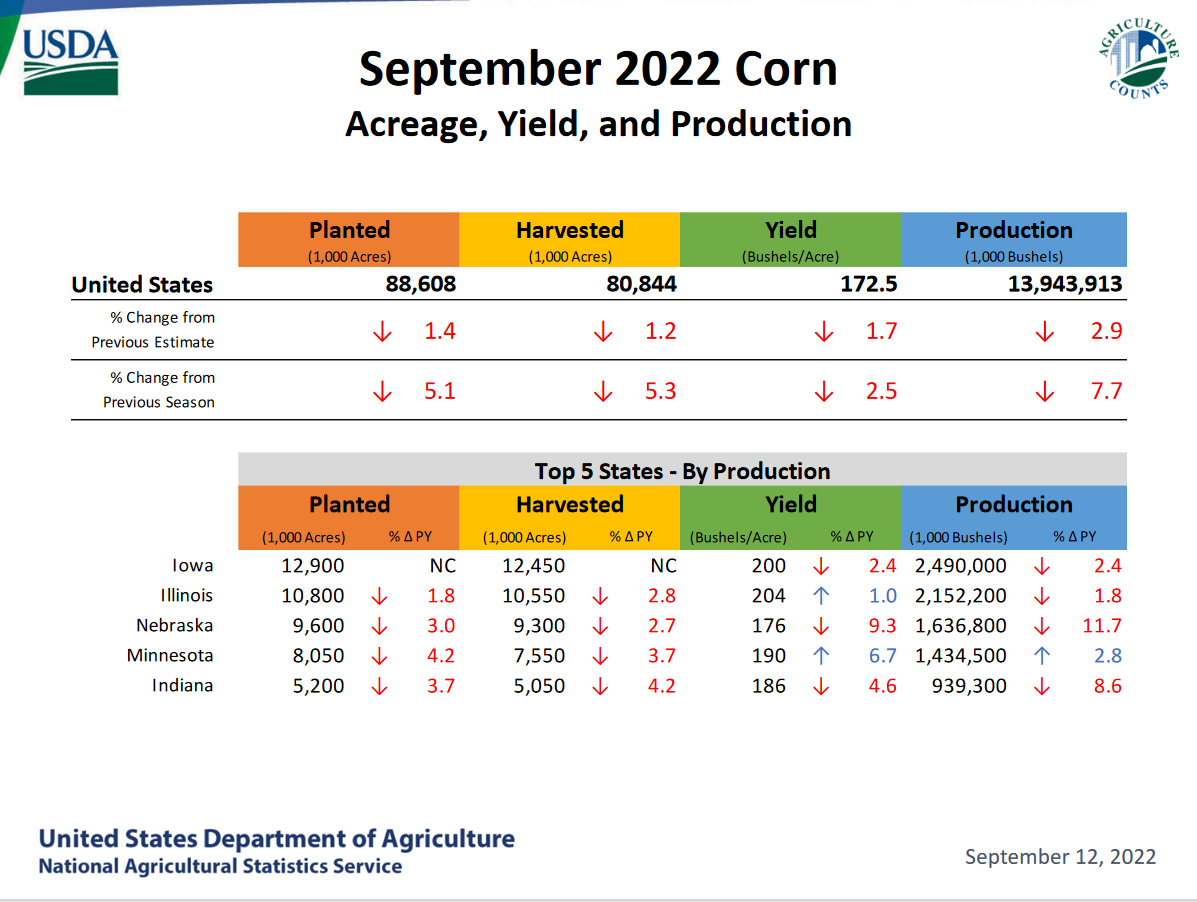
Figure 3. September 2022 Corn, Acreage, Yield and Production
The national corn yield is currently estimated at 172.5 bushels per acre which is slightly below the trendline yield. (See Figure 4.) It is relatively easy to see in Figure 5 where weather has been favorable to this year’s corn crop and where weather has been unfavorable. Iowa has had a mixed weather experience this year with rather dry areas in southcentral and northwestern Iowa, but rather favorable moisture conditions in other parts of the state, especially in the northeastern quadrant.
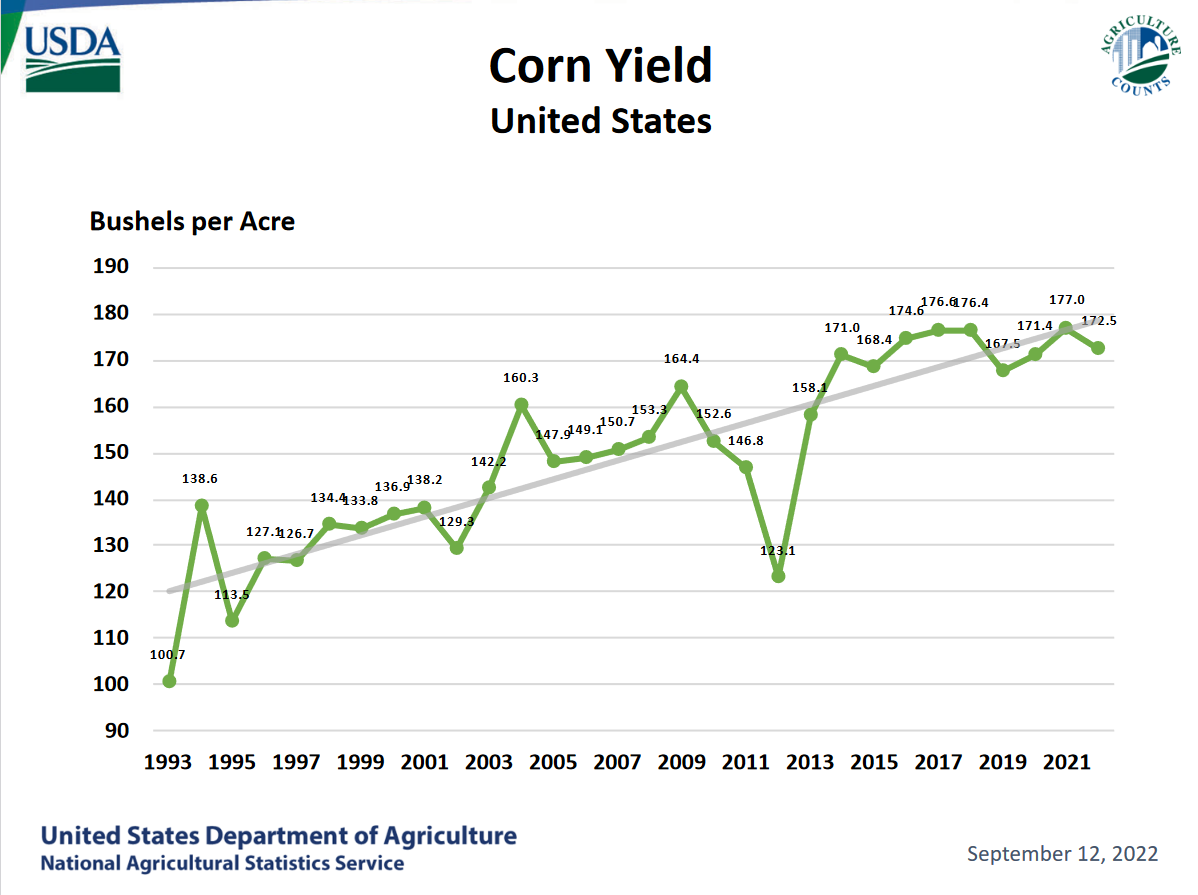
Figure 4. Corn Yield, United States
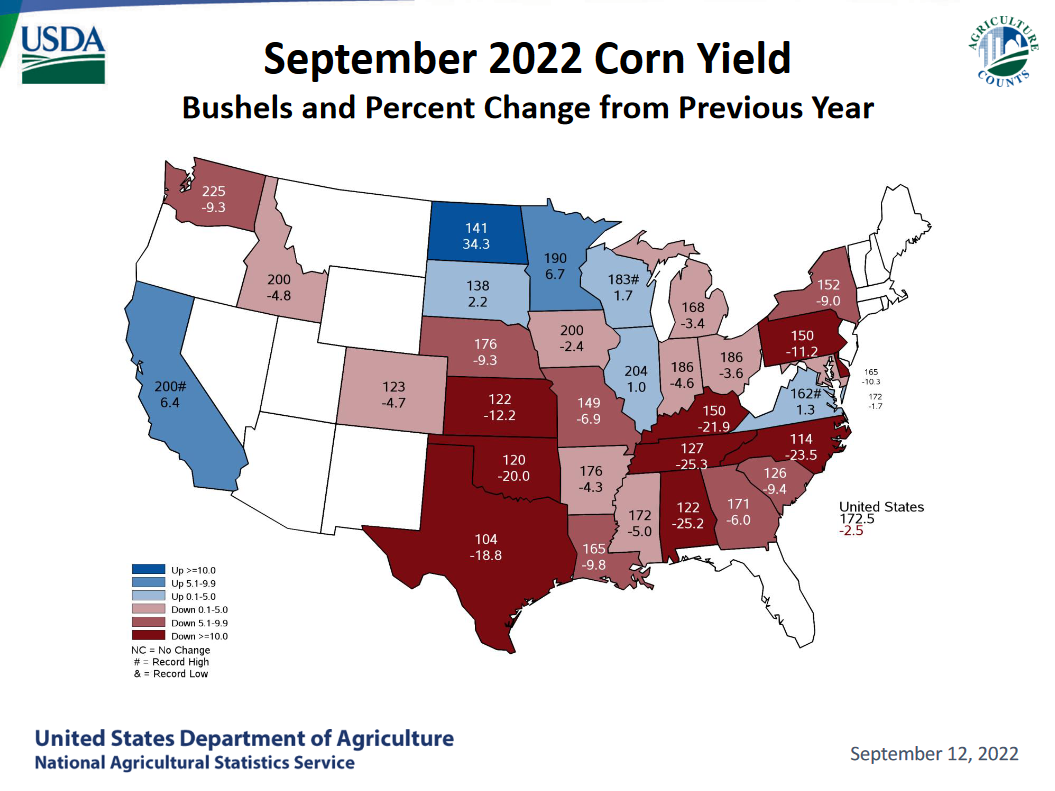
Figure 5. September 2022 Corn Yield, Bushels and Percent Change from Previous Year
Figure 6 shows the ear counts and related yields for 10-state region for 2017 through 2022 crop years. This year, the ear count per acre is down 1.3% from a year ago. The lower ear count comes despite the overall population per acre being slightly higher than a year ago. The number of “bare stalks” seen in the 10-state region last year was 0.17% whereas this year the number of bare stalks is 2.05%. Average ear weight data will not be gathered until the October report, but based on the crop condition scores, it is likely that average ear weight will be down compared to a year ago.
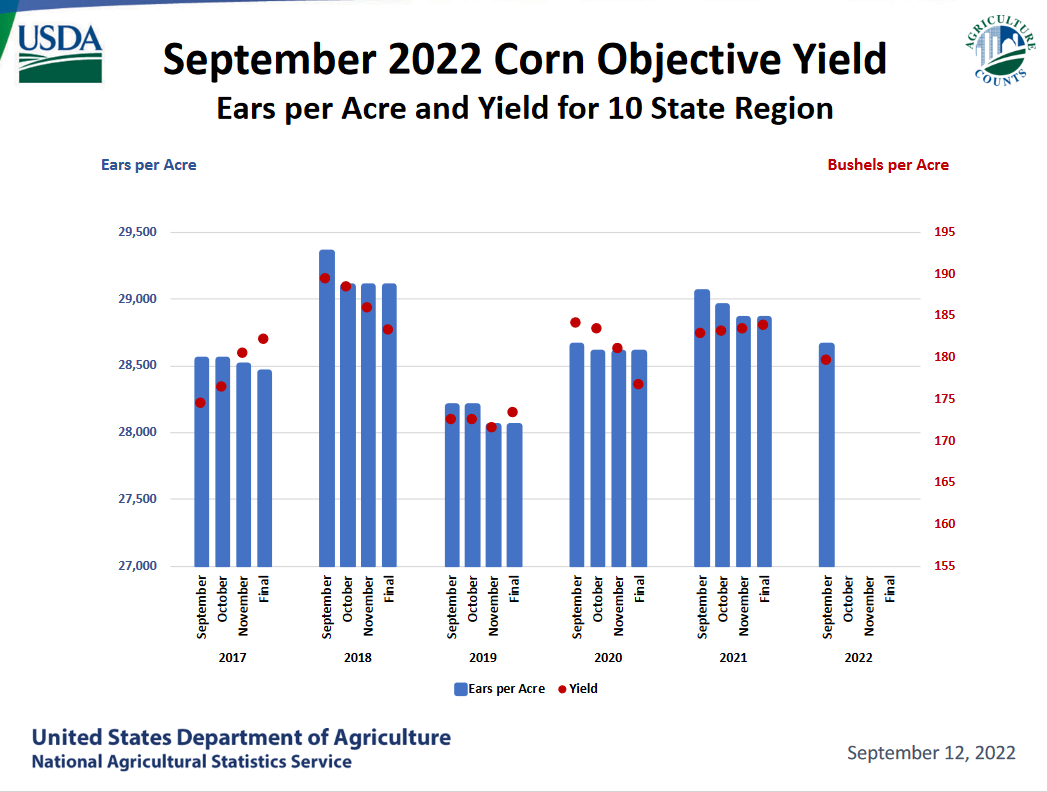
Figure 6. September 2022 Corn Objective Yield Data, Ears per Acre and Yield for 10-state Region
Figure 7 shows the Iowa population (combination of ear count and bare stalks) and the implied ear weight for the September reports for 2019-2022. While the total corn population is only down 100 stalks per acre compared to a year ago, there are an average of 800 more bare stalks per acre compared to a year ago. Additionally, the implied ear weight of 164.7 grams per ear is 4% greater than a year ago and 3.5% greater than the 3-year average ear weight in Iowa.
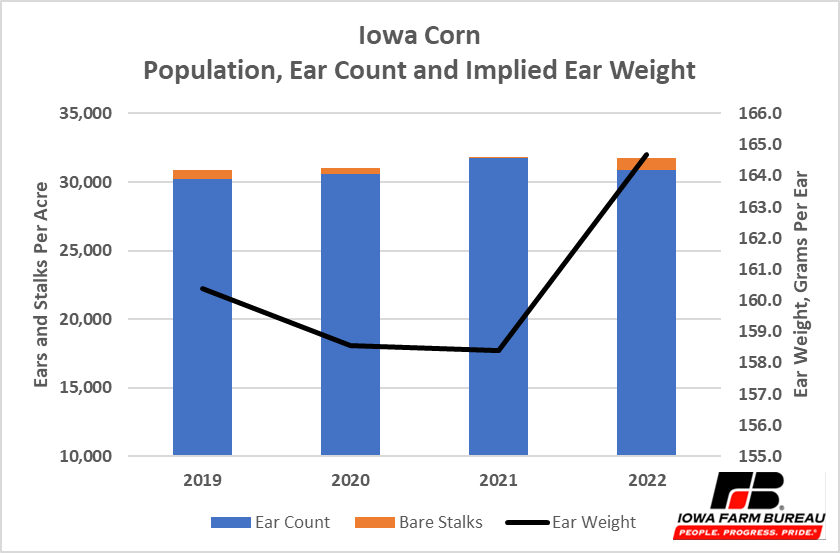
Figure 7. Iowa Corn, Population, Ear Count and Implied Ear Weight
Soybeans
The background conditions for soybeans are not quite as bad as for corn with regards to crop conditions. The percent of the soybean crop rated Good to Excellent has steadily declined since spring but is about the same as last year and better than 2019 at this point in the growing season. (See Figure 8.)
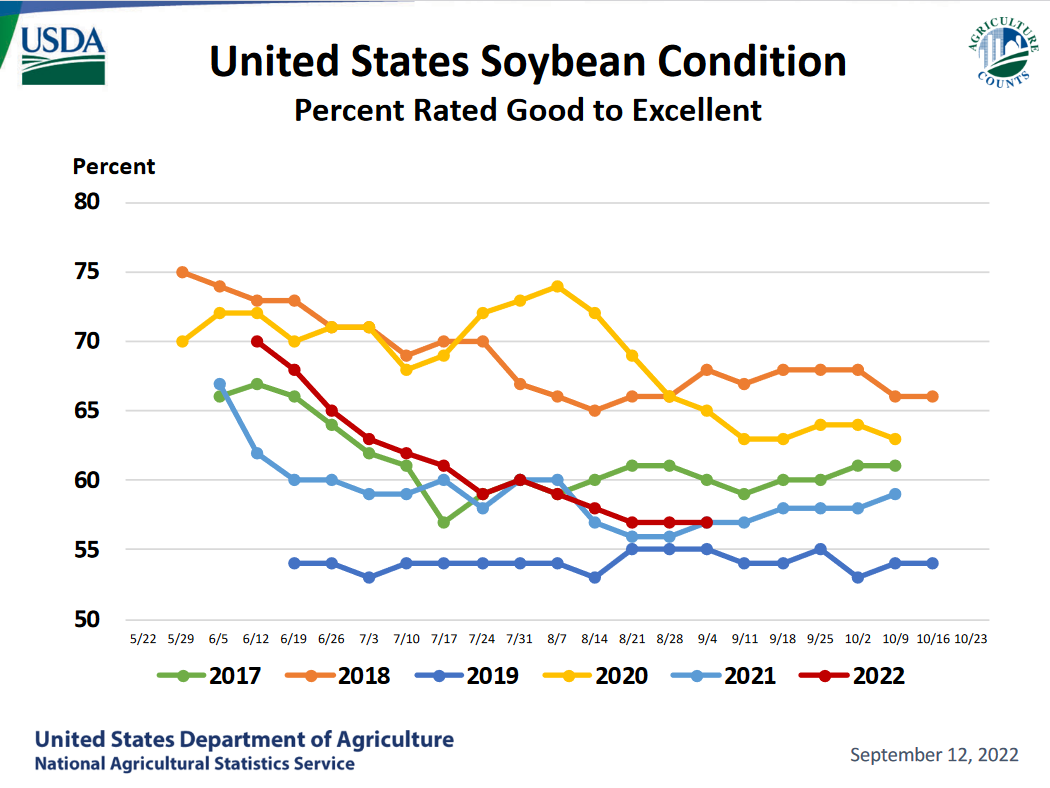
Figure 8. U.S. Soybean Condition, Percent Rated Good to Excellent
The summary of key changes in acreage, yield and production for the 2022 soybean crop are shown in Figure 9. Planted acreage was dropped 0.6% from the August report, anticipated harvested acres declined 0.7%, yield was lowered 2.7% and production was lowered 3.4% from the August report. Compared to last year, planted and harvested acreage are up 0.3%, yield is expected to be down 1.8% and production down 1.3%.
For Iowa, there was no change in planted acreage from the August estimate, however estimated harvested acres of soybeans was decreased 0.1%. The yield estimate declined 4.8%, thus production is estimated to decline 4.9% from the previous report. Of the other top 5 soybean producing states, only Minnesota had an acreage decline (-2.6%) whereas the other three major soybean producing states had increases is estimated harvested acreage with Illinois up 1.8%, Indiana up 3.4% and Nebraska up 2.3%. The yield estimate for Illinois was unchanged from last month, Minnesota and Indiana were increased and the yield estimate for Nebraska declined.
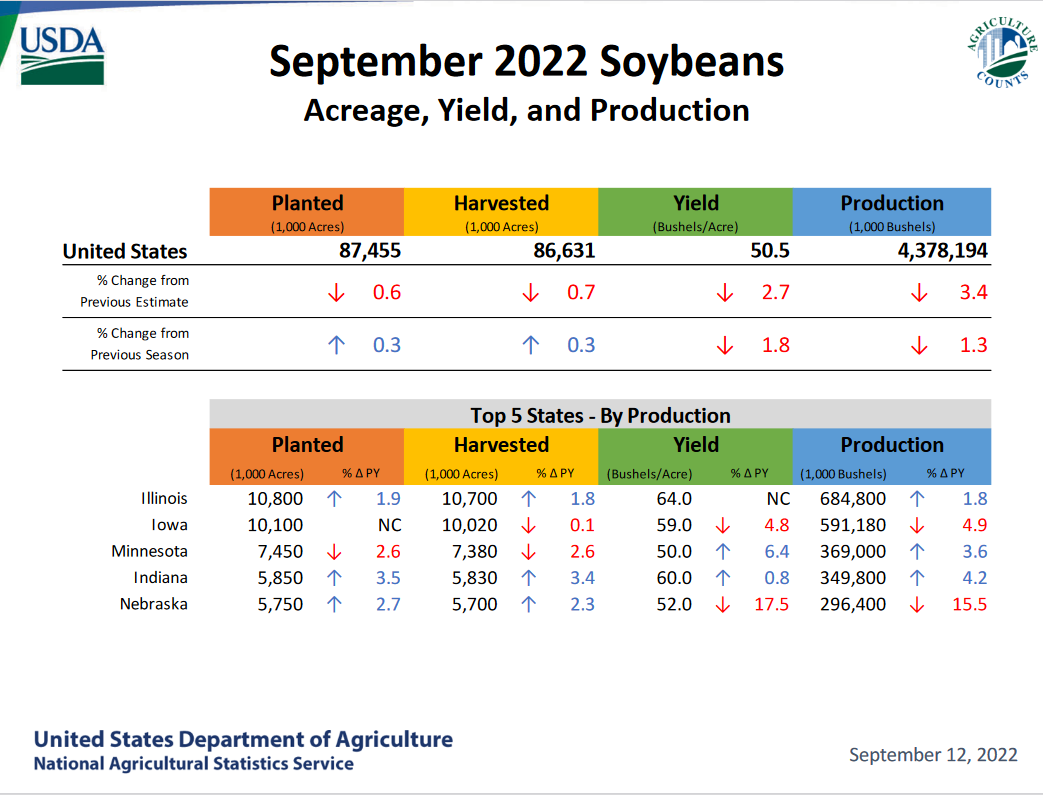
Figure 9. September 2022 Soybeans, Acreage, Yield and Production
The U.S. soybean Yield is currently estimated to be 50.5 bushels per acre. This is just slightly below the long-term trendline, and if realized would be just the second below-trendline yield for U.S. soybeans since the 2010-2013 period when soybean yields were below trendline for 4 consecutive years. (See Figure 10.)
The map (Figure 11) for soybean yields shows the negative impact that weather has been having on soybean production areas especially in the southern Plains states, but also in the Mid-Atlantic area. The upper Midwest is seeing more favorable weather for soybean production in 2022 than they had last year despite a relatively late start to the growing season. Record yields are currently projected for Arkansas, Mississippi, and Indiana. But all around those states, growing conditions for soybeans have been less favorable this year than last year.
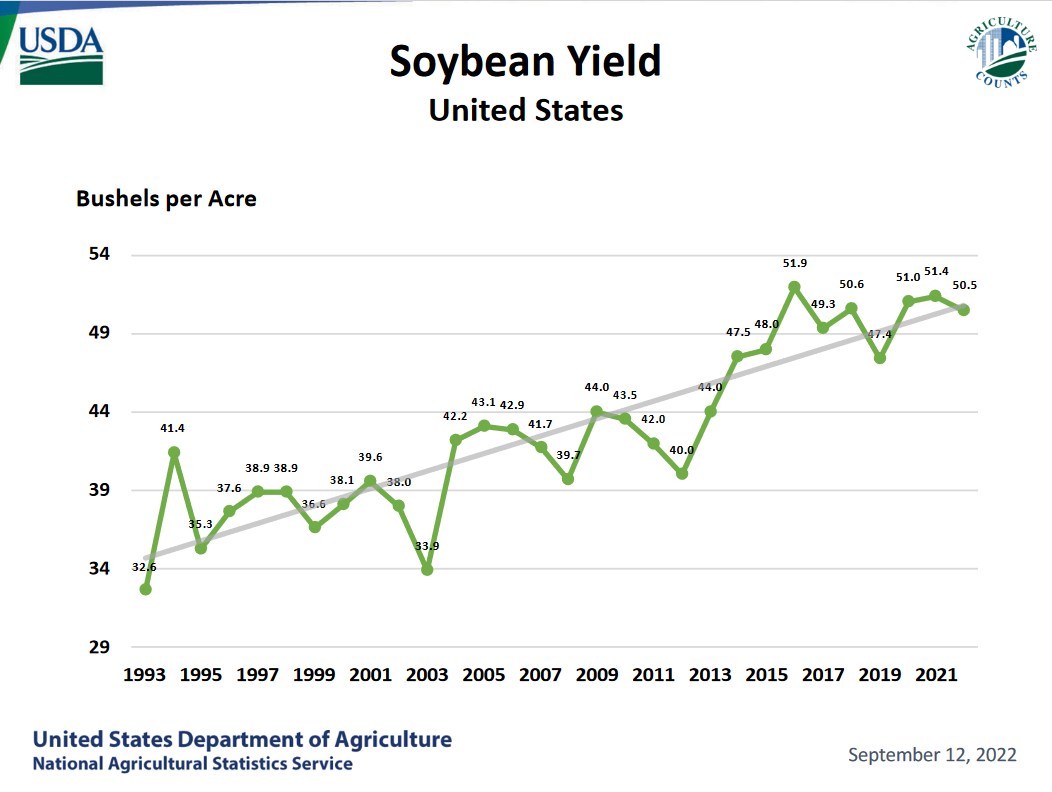
Figure 10. Soybean Yield, United States
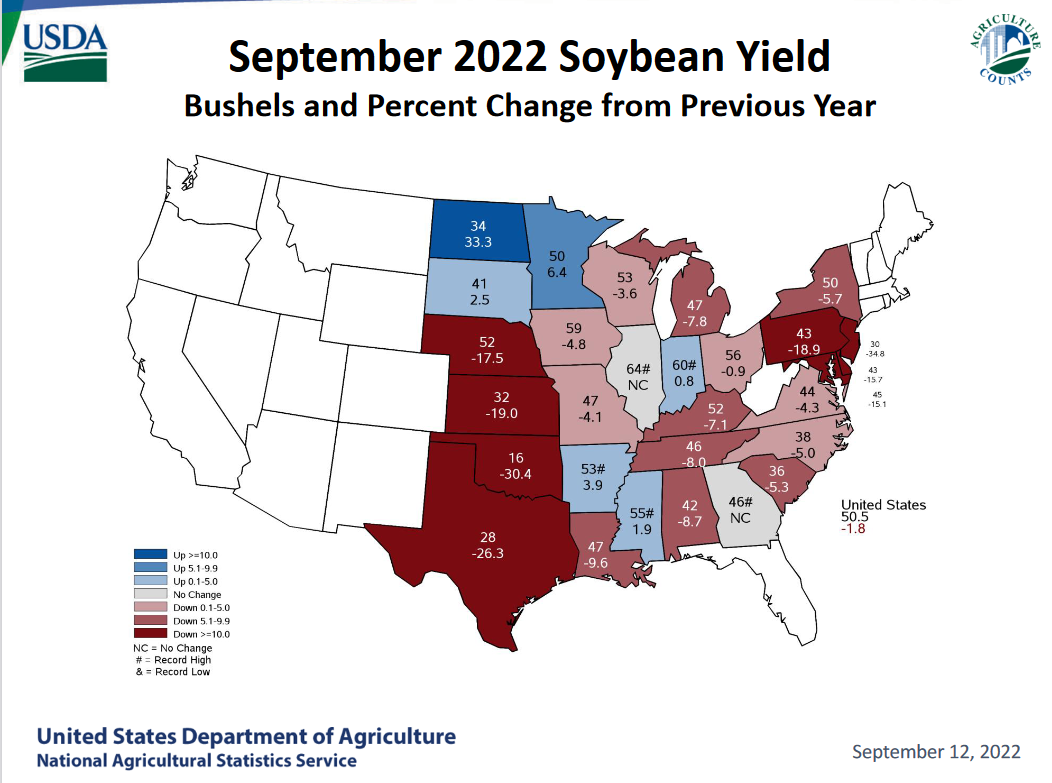
Figure 11. September 2022 Soybean Yield, Bushels and Percent Change from Previous Year
As shown in Figure 12, pod counts in the 11-state region are significantly lower than last year and nearly as low as the last time yield was below-trend (2019). The October crop report will include seed weight and it is still “up in the air” as to how much some late August – early September rains may help put on extra weight in the pods that are there. Currently, the implied seed weight suggested by the yield estimates would be a record high 0.38 grams of seed per pod. The previous high was set in 2019 at less than 36 grams per pod. This would suggest that there is room for soybean yields to modestly decline in future reports as it is unlikely that pod counts will increase much and pod fill is likely to be less than 0.38 grams of seed per pod.
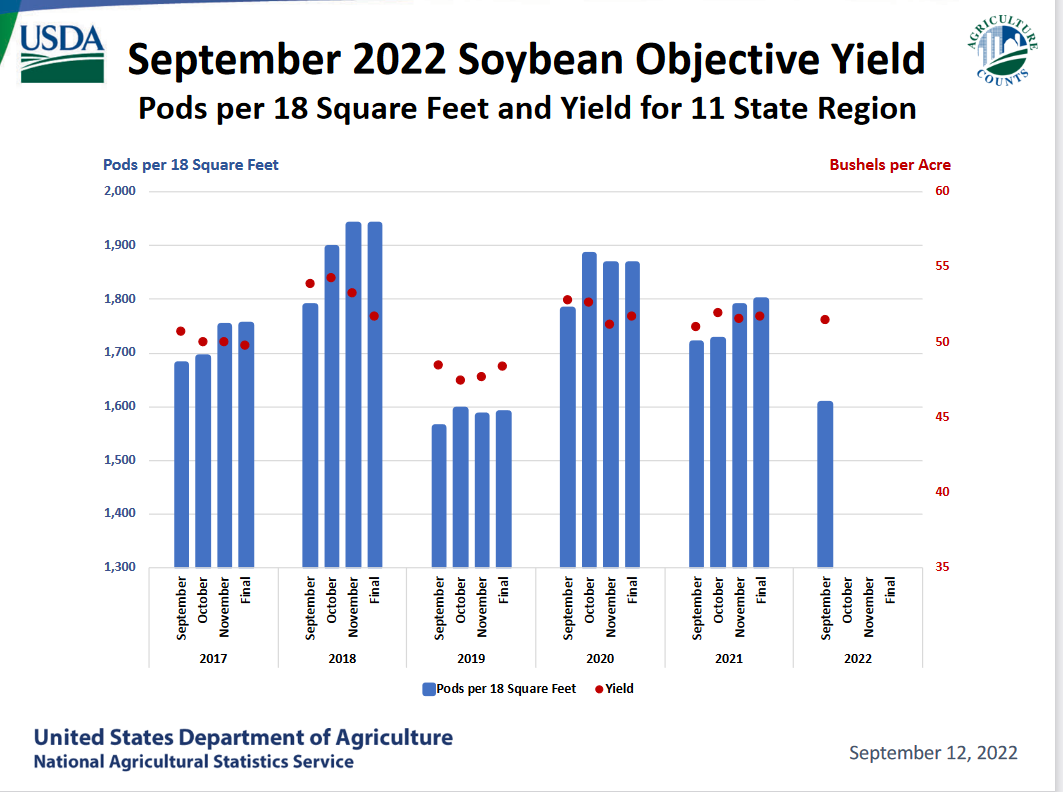
Figure 12. September 2022 Soybean Objective Yield, Pods per 18 Square Feet and Yield for 11-State Region
The Iowa soybean pod count per 18 square feet is down 8.5% from last year and down 5.1% from the average of the last three years (Figure 13). The implied seed weight per pod for Iowa soybeans is up 9.3% from last year and 11.6% higher than the average of the past three years.
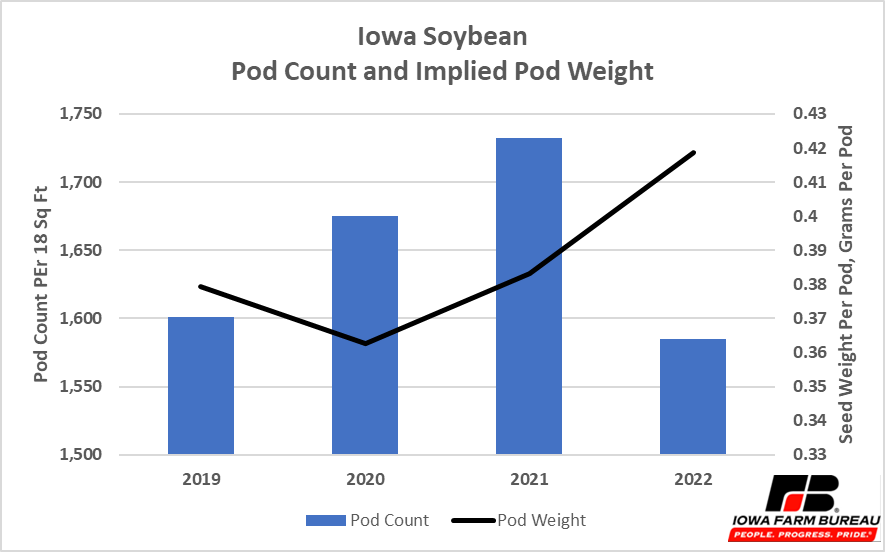
Figure 13. Iowa Soybean, Pod Count per 18 Square Feet and Implied Pod Weight
Economic analysis provided by David Miller, Consulting Chief Economist, Decision Innovation Solutions on behalf of Iowa Farm Bureau.
Want more news on this topic? Farm Bureau members may subscribe for a free email news service, featuring the farm and rural topics that interest them most!