Russia/Ukraine Disruptions and U.S. Grain Trade Flows
Author
Published
7/6/2022
Russia/Ukraine Disruptions and U.S. Grain Trade Flows (06/30/2022).
Russia and Ukraine are important producers of agricultural commodities globally. Their share in global production is particularly significant for sunflower seed, barley, wheat, rapeseed, corn, and to a lesser degree for soybeans. The two countries together made up 56% of world sunflower seed production between 2018/19 and 2020/21, on average. Also, these two countries accounted for 18% and 14% of global barley and wheat production, respectively, during that period (see Figure 1).
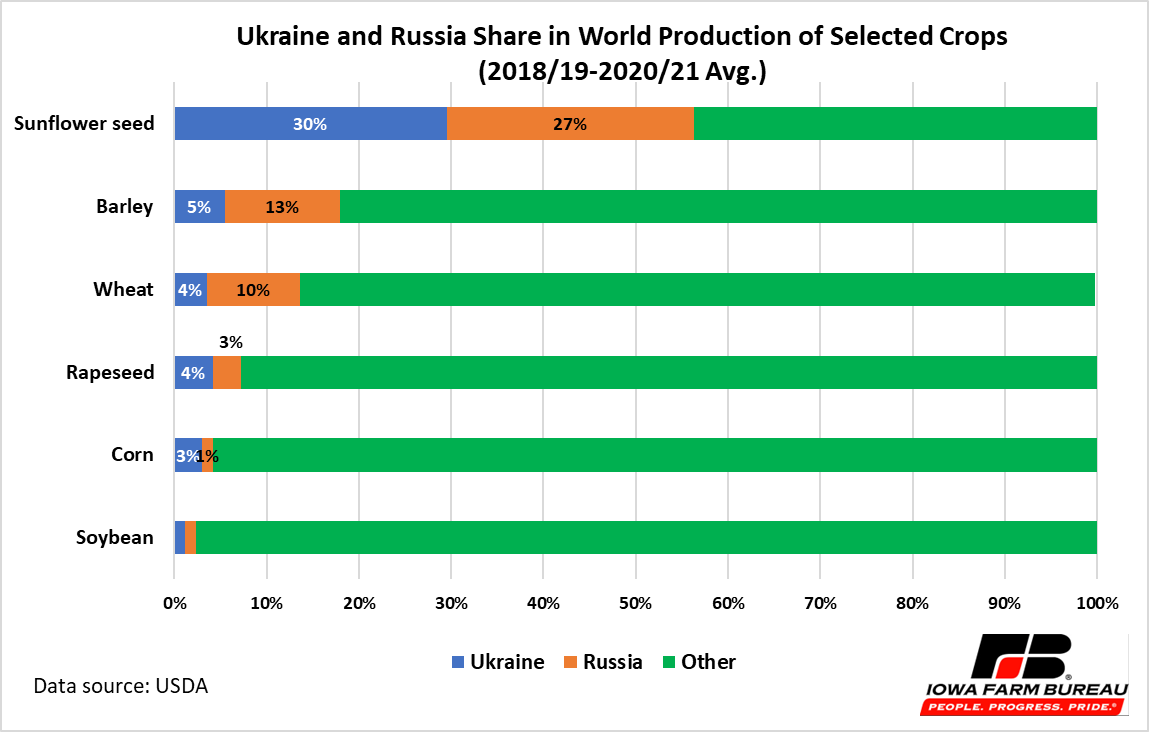
Figure 1. Ukraine and Russia Share in World Production of Selected Crops (2018/19-2020/21 Avg.)
In terms of trade, Ukraine and Russia are key suppliers of crops and agricultural products to many countries around the world. The totaled exports from Ukraine and Russia supplied 77% of world sunflower seed oil, during 2018-19-2020/21, on average. The export share of these two countries was lower for other crops and products but still significant. For example, Ukraine’s and Russia’s shares of global exports of barley and wheat (i.e., wheat, flour and products) were at 32% and 29%, correspondingly, during the three-year period. Whereas for sunflower seed, rapeseed, and corn, the combined shipments from these two countries made up 25%, 20%, and 18%, respectively, over the 2018/19 -2020/19 years, on average. Ukraine and Russia supplied 1% each of global soybean exports, on average, (Figure 2).
Customarily, most exports from Ukraine have been carried out by sea. According to a report by FAO1 (June 2022), the ongoing fighting in Ukraine, has damaged the country’s infrastructure, from inland to seaport to storage and processing, causing suspension of commercial shipments across ports. The country has limited means of alternative transportation, including rail, river, or road transport. Ukraine has switched to shipping by land, including by rail, but volumes are low.
Further aggravating the current situation in Ukraine, is the increase in insurance premium rates or the nonexistence of war coverage in insurance contracts for vessels sailing to the Black Sea. This results in higher costs of food imports from this country.
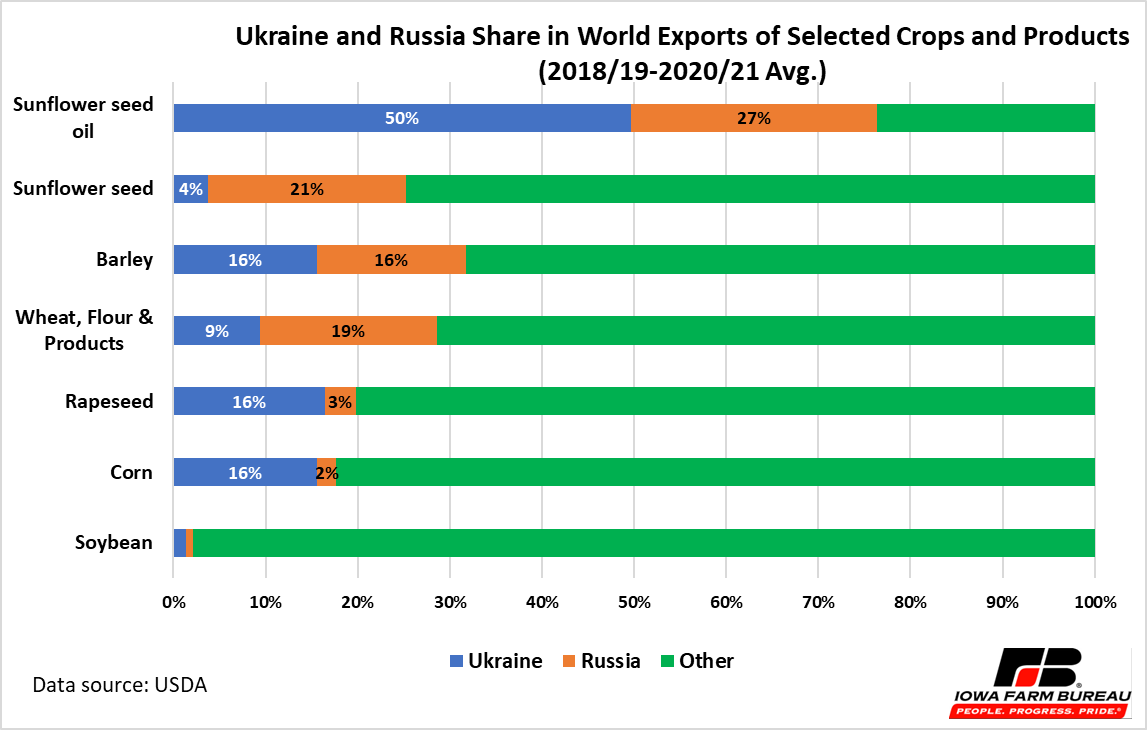
Figure 2. Ukraine and Russia Share in World Exports of Selected Crops and Products (2018/19-2020/21 Avg.)
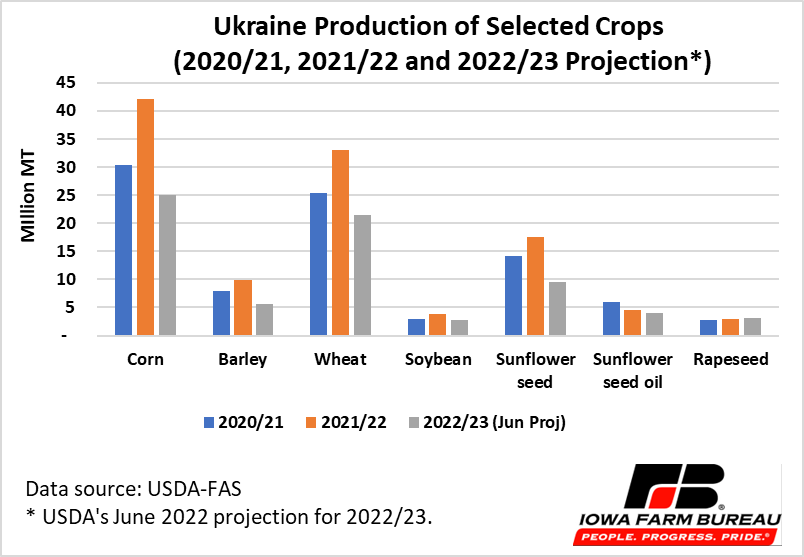 Because of current conditions in Ukraine, the latest USDA’s production and export projections (June 2022) for the 2022/23 year indicate reductions for most crops and products compared with the previous year. If realized, 2022/23 Ukraine’s production would decline more than 35% for crops such as sunflower seed (46% to 9.5 million MT), barley (43% to 5.7 million MT), corn (41% to 25.0 million MT), and wheat (35% to 21.5 million MT) (Figure 3). For soybeans and sunflower oil, production would decline 26% to 2.8 million MT and 10% to 4.1 million MT. For Russia, the projections indicate that production of corn, barley, wheat, and soybean would increase in the 2022/23 marketing year, with highest increase in barley and soybean production at 11%.
For the US, except for US corn production, which would decline 4% to 367.3 million MT in 2022/23, the projections for all the commodities shown in Figure 3 would increase. US barley production is forecast to grow 54% to 3.9 million MT. US wheat and soybean production would expand 6% (to 47.262 million MT) and 5% (to 126.280 million MT) in 2022/23, respectively. The productions of US rapeseed and sunflower seed are projected to rise to 43% and 23% in the next marketing year, respectively.
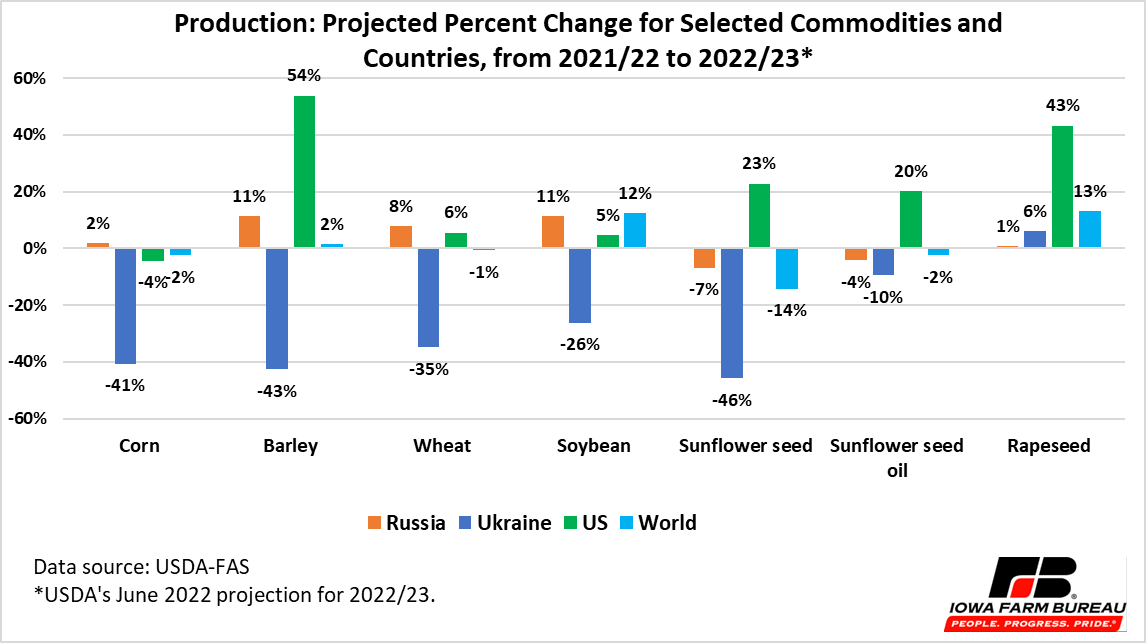
Figure 3. Production: Projected Percent Change for Selected Crops and Countries from 2021/22 to 2022/23
USDA export projections in June 2022 for the 2022/23 marketing year for selected commodities and countries are shown in Figure 4. For Ukraine, exports of corn, wheat, barley, sunflower seed, and sunflower oil are all expected to fall (Figure 4).
If these projections are realized, Ukraine corn exports would be down 61% to 9.0 million MT compared with 23.0 million MT the previous year. The country’s share of corn global exports would drop to 5% compared with 12% in 2021/22. According to projections, US corn exports would remain the same as in 2021/22 marketing year at about 62.0 million MT, while exports from other countries (Rest of the world) would increase by 8%. Among these countries, Brazil is projected to expand corn exports by 37% to 46.5 million MT in 2022/23. Overall, world corn exports are forecast to decline 3% to 183.197 million MT.
In addition, Ukraine’s exports of wheat are projected down 47% to 10.0 million MT in the next marketing year. US wheat shipments are expected to fall 3% to 21.0 million MT, accounting for 10% share in world export. Because of Russia’s 21% projected increase in wheat exports to 40.0 million MT, global wheat exports are expected to rise 2% to 205.449 million MT. Russia would continue as the top exporter of wheat with a global market share of 19%, which would be up from 16% in the previous year. Other countries such as Canada, European Union, Kazakhstan, and Turkey would also expand their shipments of wheat in 2022/23.
Barley shipments from Ukraine are forecast to drop 22% (to 1.8 million MT) in 2022/23. US barley shipments would increase 20% to 0.150 million MT, but it would make up less than 0.5% of global shipments. In contrasts, Russian exports of barley would increase 50% to 6.0 million MT and would account to 20% of world barley shipments. World barley shipments would remain about the same as in 2021/22.
Ukraine’s forecast decline of 25% (to 0.750 million MT) in sunflower seed exports in 2022/23 would be compensated by an expected 300% (to 0.600 million MT) increase in Russian shipments, as well as shipments from other countries (9% to 2.226 million MT). The US is not expected to increase exports of sunflower seed and would remain at 0.05 million MT.
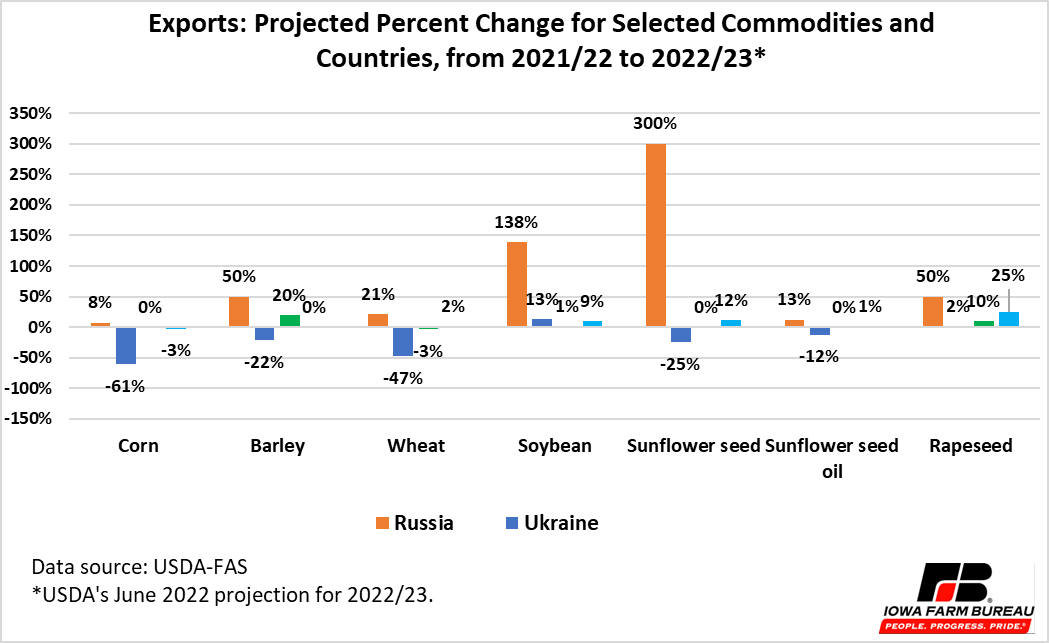
Figure 4. Exports: Projected Percent Change for Selected Crops and Countries from 2021/22 to 2022/23
Economic analysis provided by Patricia Batres-Marquez, Senior Research Analyst, Decision Innovation Solutions on behalf of Iowa Farm Bureau.
Want more news on this topic? Farm Bureau members may subscribe for a free email news service, featuring the farm and rural topics that interest them most!