New record for U.S. ethanol production and exports in 2018 and an update on Iowa’s ethanol industry
Author
Published
3/28/2019
This report presents the latest information on U.S. ethanol production and exports to leading destinations and highlights Iowa’s ethanol industry and the importance of this industry in supporting corn prices.
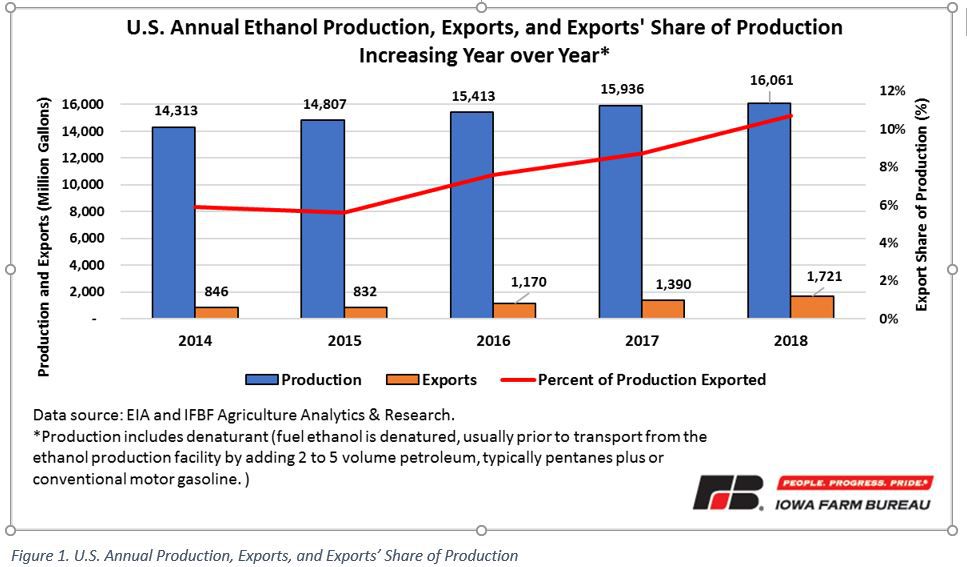
USDA’s Grain Crushings and Co-Products Production report, indicates over 5.55 billion bushels of corn were crushed for fuel ethanol during the 2018 calendar year. The Energy Information Administration (EIA) reported a production volume of 16.061 billion gallons of U.S. ethanol during the same period, up about 1 percent compared with calendar year 2017 (see Figure 1).
Based on data released by EIA on March 8, 2019, U.S. ethanol exports were estimated at a record volume of more than 1.72 billion gallons during the 2018 calendar year, which were up 23.8 percent from 2017. As Figure 1 shows, 2018 ethanol exports surpassed the annual volumes exported during calendar years 2014 through 2017. U.S. ethanol exports as a share of production has been increasing since 2016 contributing to market expansion. In 2018, 10.7% of production was shipped to foreign markets compared with 8.7 percent during 2017.
EPA is expected to finalize their E15 (blend of 15% ethanol and 85% gasoline) rule before the start of this year’s summer driving season. This regulation would allow sales of E15 year-round. Increases in E15 consumption during the summer months in areas where the required infrastructure is already in place is anticipated. According to Iowa Renewable Fuels Association, there are 172 E15 refueling sites across the state.
Brazil the leading export market for U.S. ethanol in 2018
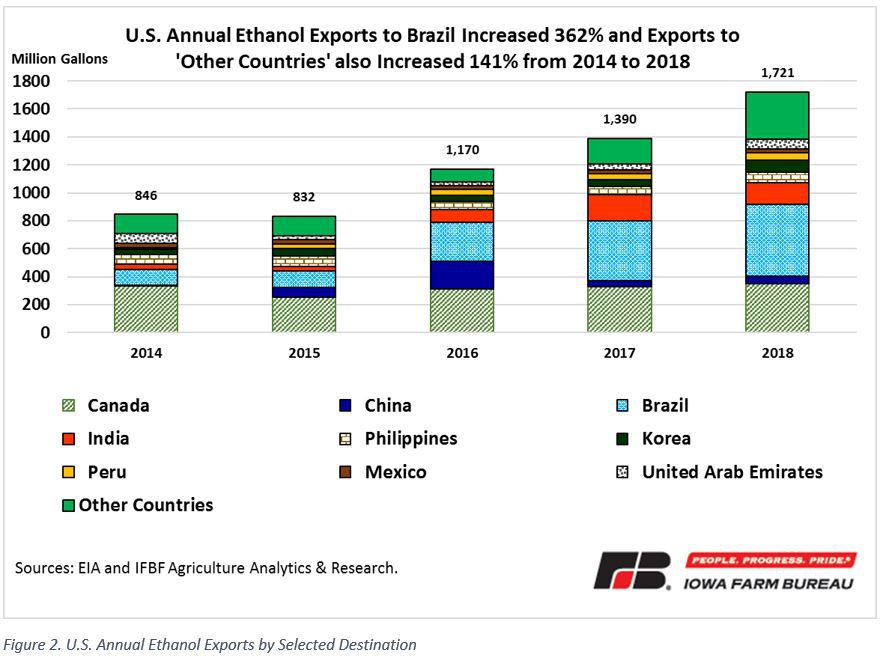
Brazil, Canada, and India continued as the leading foreign destinations for U.S. ethanol in 2018. Based on volume, 59.2 percent (1.020 billion gallons) of U.S. ethanol exports went to these three markets in 2018, with Brazil as the leading market destination with 29.8 percent (513 million gallons) of total shipments. Exports to Brazil have been increasing since 2014. U.S. ethanol exports to China declined 73% compared with record highs in 2016, mainly due to China’s retaliatory tariffs imposed on U.S. ethanol[1]. The United States exported 338.2 million gallons of ethanol in 2018 to other markets, up 84 percent from last year (see Figure 2). U.S. ethanol exports to other markets increased 243.4 million gallons in 2018 compared with 2016. Whereas U.S. ethanol exports to China dropped 145.4 million gallons during the same period. This indicates exports to other markets have more than offset the decline in exports to China.
Based on data reported by EIA, the United States imported 54.3 million gallons of ethanol in 2018. Ninety eight percent of those imports came from Brazil. 2018 U.S. ethanol imports declined 29 percent from the previous calendar year. The U.S. was a substantial net exporter of ethanol in 2018.
Iowa is the U.S. leader in ethanol production
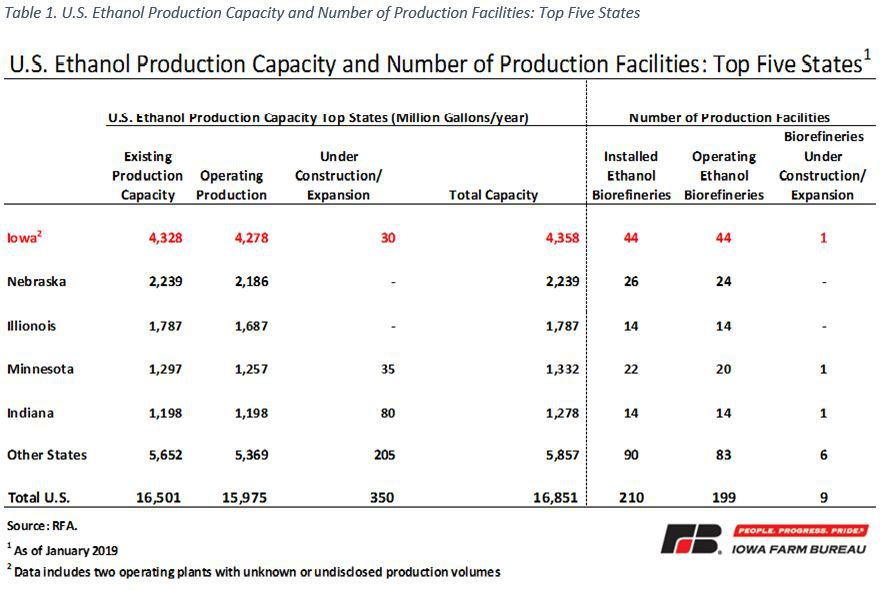
According to the Renewable Fuels Association, as of January 1, 2019, the U.S. ethanol industry had an existing capacity of 16.501 billion gallons per year. The operating capacity was reported at 15.975 billion gallons per year resulting in an idle capacity of 0.526 billion gallons per year[2]. Iowa is the leader in the U.S. ethanol industry with a share in production capacity of 26.2 percent, which is equivalent to 4.328 billion gallons per year. At 4.278 billion gallons per year, almost all existing capacity in Iowa is in operation (see Table 1). Iowa currently has 44 installed ethanol biorefineries. One of those biorefineries is being expanded, which will add 30 million gallons this year to its existing production capacity.
Based on USDA-NASS data, Iowa corn production from 2014/15 to 2018/19 marketing years was 2.546 billion bushels, on average. A “good” portion of Iowa’s corn production goes to the state’s ethanol biorefineries. Assuming a conversion factor of 2.8 gallons of ethanol per bushel of corn and Iowa’s ethanol operating production capacity at the beginning of 2019, the state biorefineries could consume about 1.528 billion bushels during the calendar year. In February 2019, EIA released annual data about ethanol production by state. The most recent data is up to 2016. As Figure 3 shows, Iowa produced over a quarter of U.S. total ethanol production from 2010 to 2016, almost doubling the production of the second largest state, Nebraska.
Ethanol 2019 Outlook
EIA’s Short-Term Energy Outlook (STEO) published on March 12, 2019, forecasts a slight decrease in ethanol production in 2019. Production is expected to decline from 1.05 million barrels per day in 2018 to 1.04 million barrels this calendar year, reflecting low ethanol producer margins and constrained domestic growth potential. E10 (blend of 10% ethanol and 90% gasoline) is the ethanol blend most sold in the United States. The ethanol-gasoline blending rate is projected at 10.2 percent in 2019 compared with 10.1 percent last year. The small increase indicates only a marginal contribution is expected from higher ethanol blends (e.g., E15 and E85).
Recent flooding in the U.S. Midwest affected about 13 percent of the U.S. ethanol production capacity, as some biorefineries in Nebraska, Iowa, and South Dakota were temporarily forced to shut down or reduce production due to the flooding. This large impact in ethanol production in the Midwest was not considered in the EIA’s forecasts published early in the month. With corn as the main feedstock, reduction in ethanol production could have a direct impact on corn markets. In addition, flood conditions have caused ethanol supply disruption in several markets due to railroad damage. Markets affected by this disruption may experience higher ethanol prices.
Demand for higher levels of ethanol blending beyond 10 percent remains limited in the United States. Ethanol exports are an important source of demand growth for U.S. ethanol. This benefits the ethanol industry in Iowa and supports corn prices. USDA’s March 2019 projections for the 2018/19 marketing year indicate 38.5 percent (5.550 billion bushels) of corn production would be used in corn ethanol production. This represents the largest component on the demand side of the 2018/19 corn balance sheet. However, corn use for ethanol was reduced by 25 million bushels this month compared with the previous month based on latest USDA grain crushing data and the volume of weekly ethanol production as of February reported by EIA. In addition, EIA projects 2019 ethanol exports would return to 2017 levels (about 1.4 billion gallons), as record exports to Brazil, the main market for U.S. ethanol last year, may not continue in 2019. Except for Canada, the most reliable market for U.S. ethanol, most markets for U.S. ethanol show large import variations throughout the years, so continued market diversification is key to the strengthening of U.S. ethanol exports.
S. Patricia Batres-Marquez, Senior Research Analyst, Decision Innovation Solutions (DIS). DIS is an Iowa-based economic research firm which provides regular farm economic research for Iowa Farm Bureau staff & members.
[1] On December 19, 2016, China’s State Council Tariff Committee (SCTC) released the 2017 Tariff Adjustment Plan which listed changes in tariff rates for the 2017 calendar year. On January 1, 2017, the tentative tariff rate for denatured ethanol increased from 5 percent to the World Trade Organization (WTO) Most-Favored Nation (MFN) bound rate of 30 percent. This negatively impacted the volume of U.S. ethanol exported to China in 2017. Moreover, several retaliatory tariffs imposed by China on U.S. ethanol in 2018 effectively rose tariffs to 70 percent.
[2] Operating capacity must have been larger than 15.975 billion as there were two operating plants in Iowa with unknown or undisclosed production volumes.
Want more news on this topic? Farm Bureau members may subscribe for a free email news service, featuring the farm and rural topics that interest them most!