Mississippi River Levels Low, Barge Rates Rising
Author
Published
9/24/2023
Last year Mississippi River barge rates hit extremely high levels. Averaging across the seven benchmark rates used at various points along the river, the average to ship a bushel of corn peaked at over $3/bu in 2022 (Figure 1). The rate typically sits well below $1/bu.
Recently, barge rates have begun to increase this year, following last year’s pace closely. After recovering from last year’s record low river levels, river levels have dropped again this year and this is drving shipping rates up again.
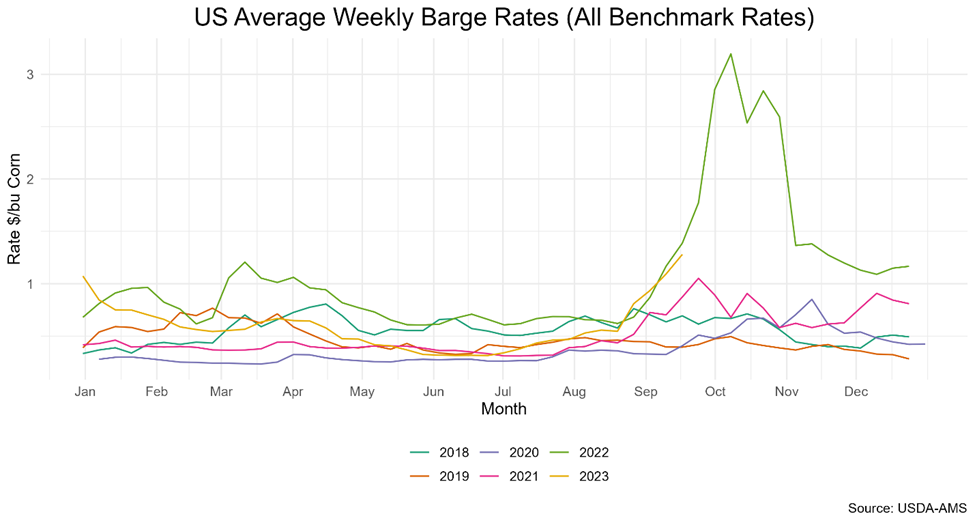
Figure 1. US Average Weekly Barge Rates (All Benchmark Rates)
As mentioned above, there are 7 benchmark rates used by different regions to price barge shipments. The major ports that use each benchmark rate is outlined in Figure 2. Notice major Iowa ports use the Mid-Mississippi benchmark.
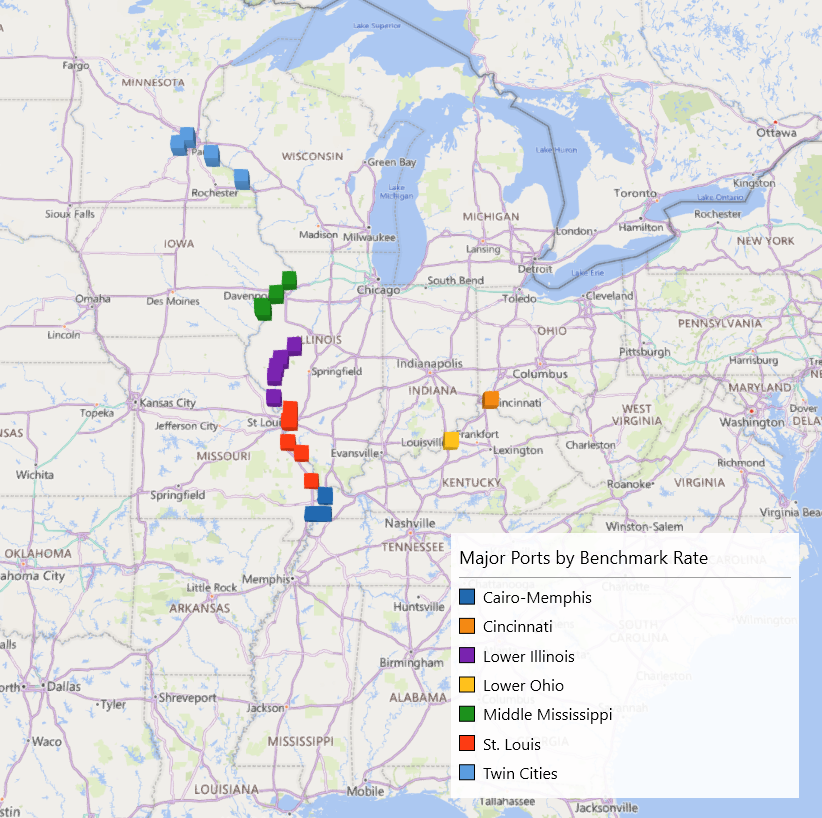
Figure 2. Major Ports by Benchmark Rate
The Mid-Mississippi barge freight rate has increased significantly over the past few weeks. Going from about $0.50/bu of corn at the beginning of August to almost $1.50/bu of corn in the middle of September. Higher barge rates negatively impact the basis along the river (Figure 3). This is especially challenging during harvest time when farmers are trying to deliver a large volume of corn and soybeans to market.
This is the third year in a row that barge Mid-Mississippi freight rates have moved substantially higher during the August – October time frame. In 2021, barge freight rates peaked in late September then fell back to more reasonable levels during the 4th quarter of 2021. In 2022, barge freight rates did not peak until late October and then remained relatively high throughout much of the 4th quarter of 2022. At the moment, river freight rates are higher than there were at comparable times in either 2021 or 2022.
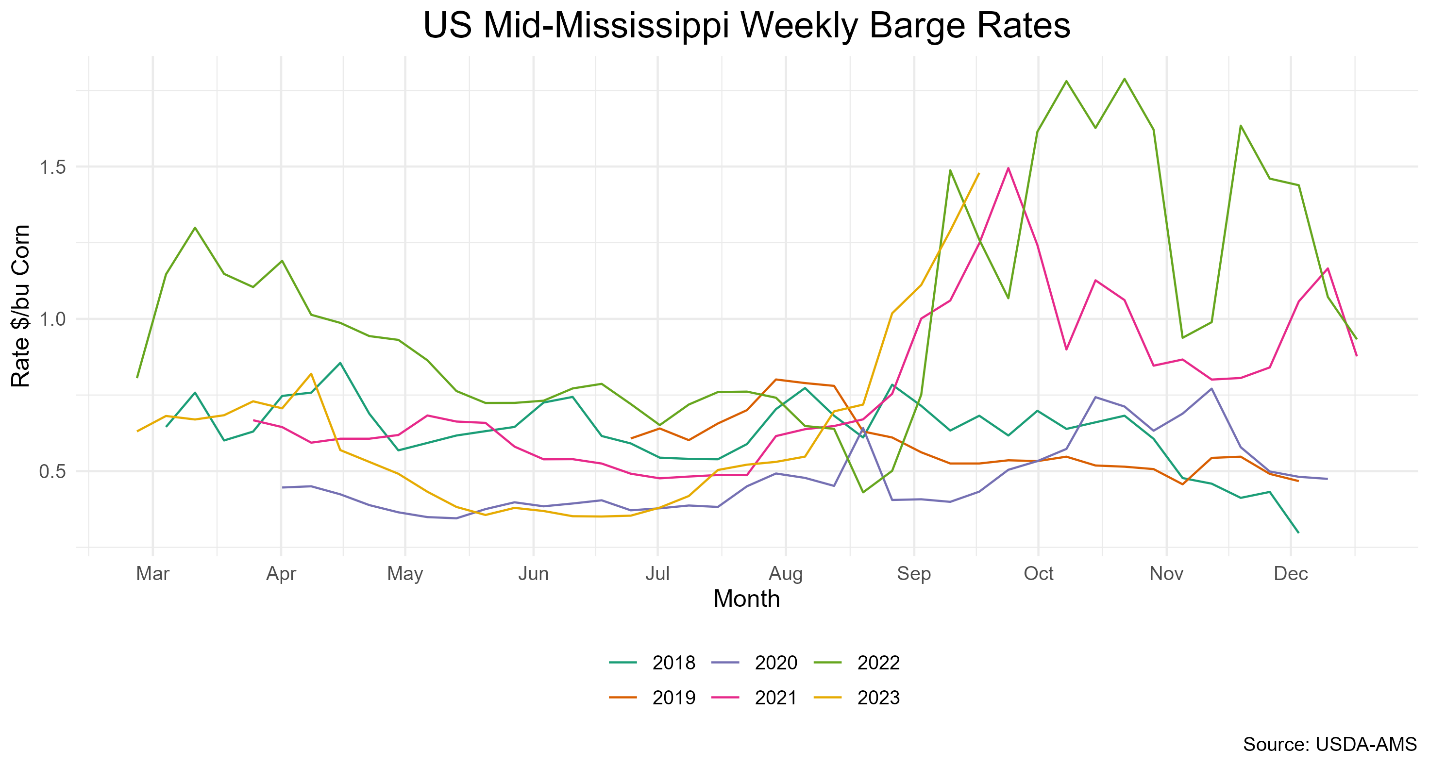
Figure 3. US Mid-Mississippi Weekly Barge Rates
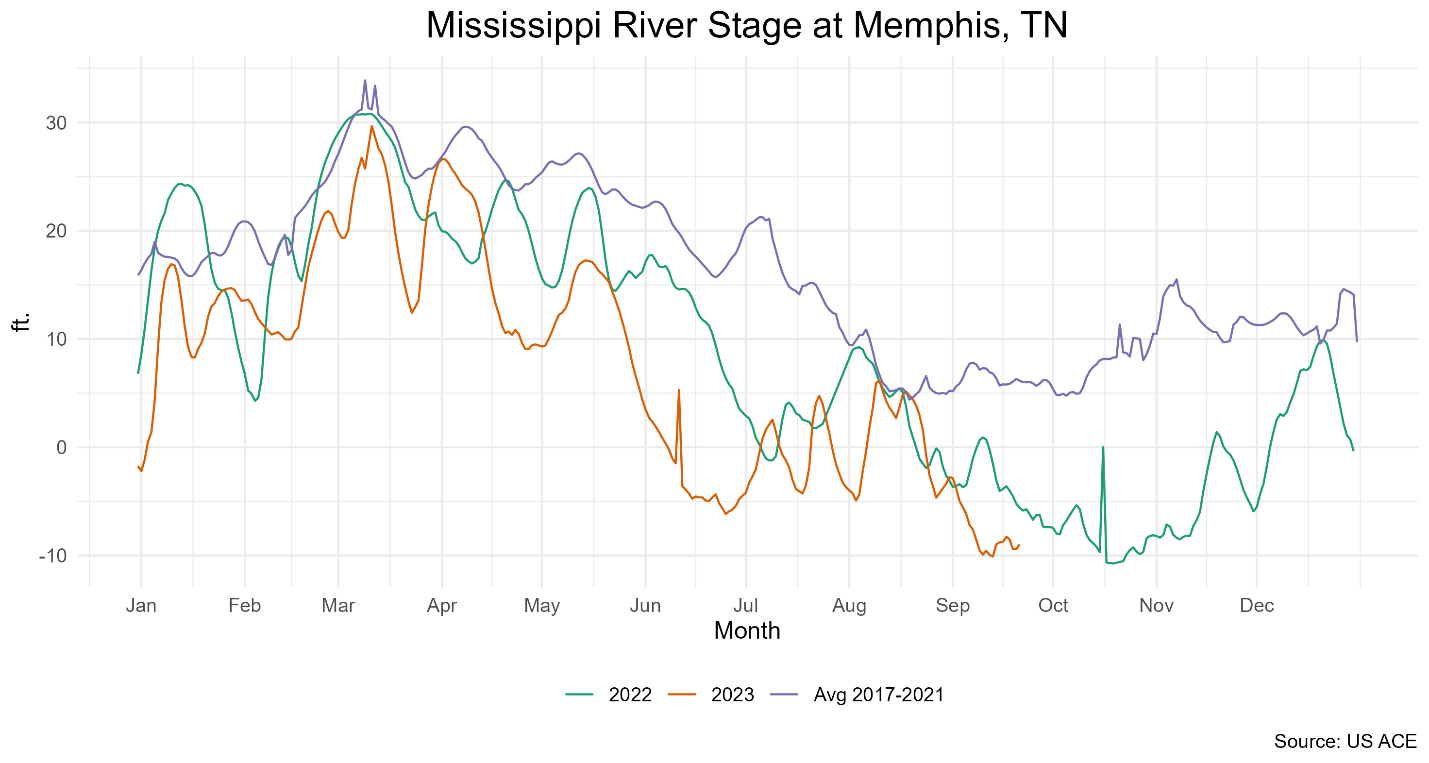
River levels have fallen in most of the US. The river stage at Memphis, TN is lower this year than it was at the same time last year and has generally been below 2022 levels since mid-April. Both 2022 and 2023 were well below the 2017-2021 average at Memphis. There have not yet been any signs of increasing levels at this station. Last year, the river level at Memphis bottomed in late October and winter re-charge brought the river level back to near normal levels by March 2023.
Like last year, drought in the Mississippi River basin is the driving factor of these low water levels (Figure 4). Recent precipitation in the Midwest is not likely to improve river levels in the very short term. Soil moisture in Midwestern fields is abnormally low across much of the area and moderate rains are being absorbed into the soil profile rather than running off and creating increased river flows.
The long run outlook provides more optimism than last year. The Drought Monitor’s current seasonal outlook has drought conditions improving in many portions of the Mississippi river basin, including the Upper Midwest (Figure 5).
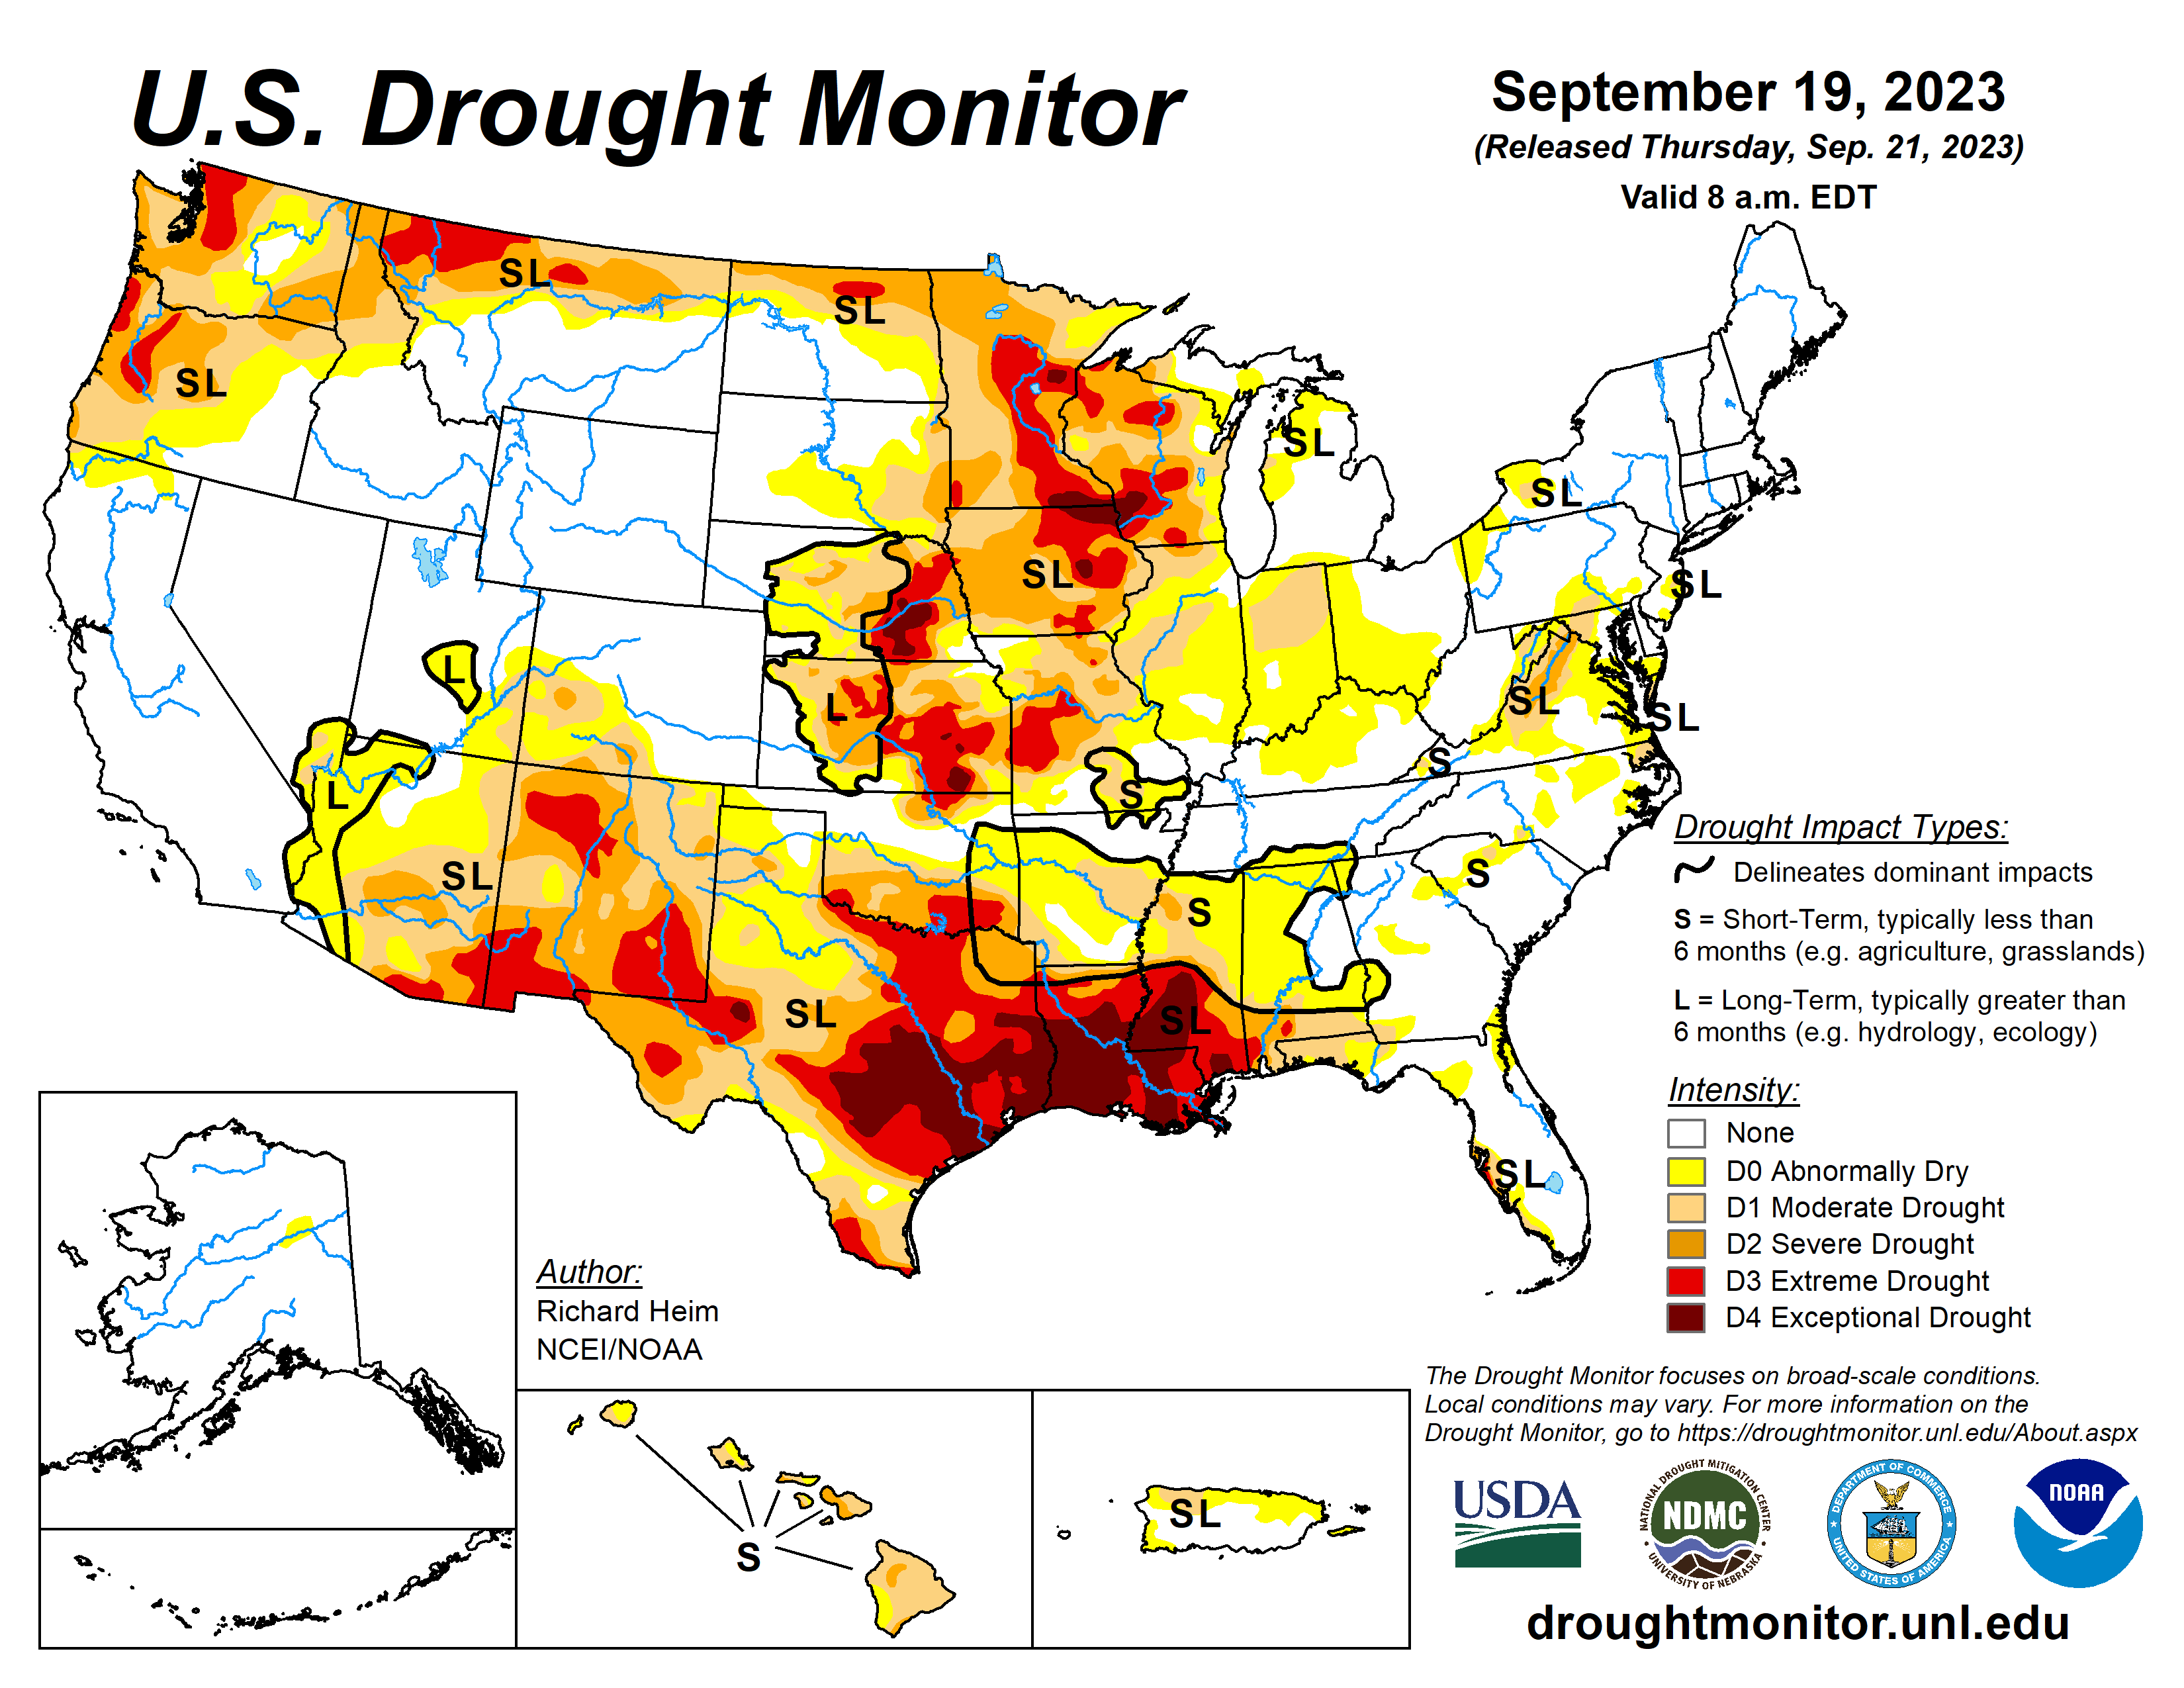
Figure 4. US Drought Monitor
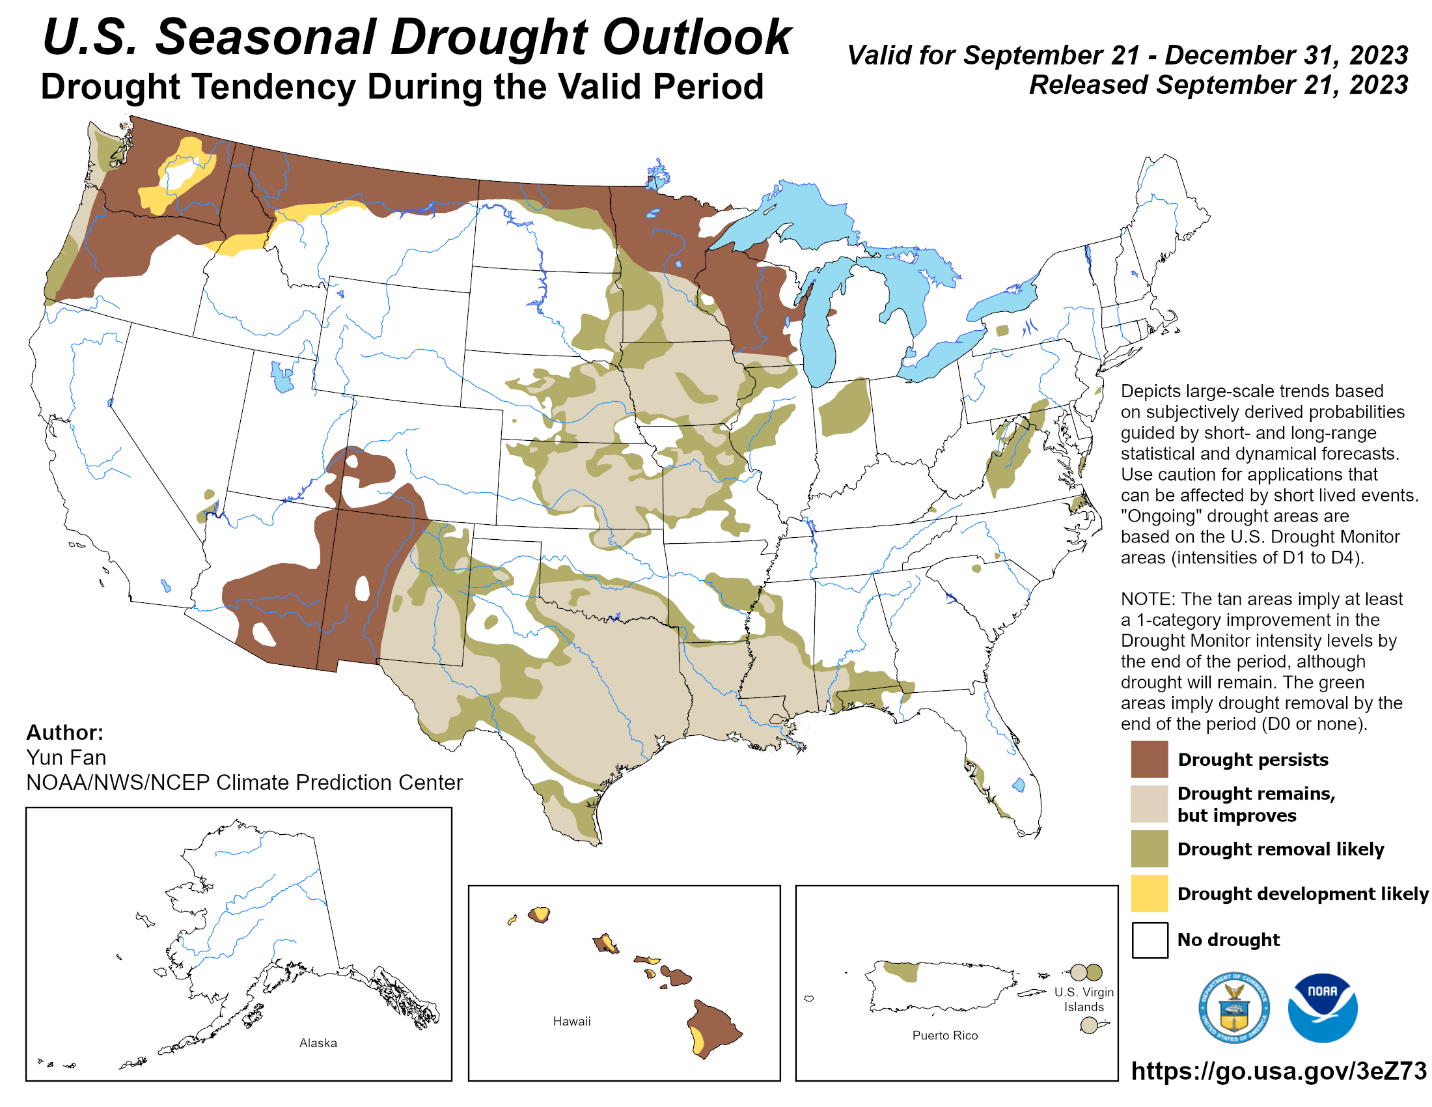
Figure 5. US Drought Monitor Seasonal Outlook
Want more news on this topic? Farm Bureau members may subscribe for a free email news service, featuring the farm and rural topics that interest them most!