March 2023 Inflation Update
Author
Published
4/17/2023
The US All Items Consumer Price Index (CPI) increased 5.0% year-over-year in March 2023, down from 6.0% last month (Figure 1). This is the lowest year-over-year increase in the All-Items CPI since May of 2021.
Year-over-year core inflation on the other hand was up slightly from last month, sitting at 5.6% in March, up from 5.5% from February. This was the first time since May 2021 core inflation has been higher than all-items inflation. While year-over-year total inflation has been coming down, core inflation has been much slower to decrease.
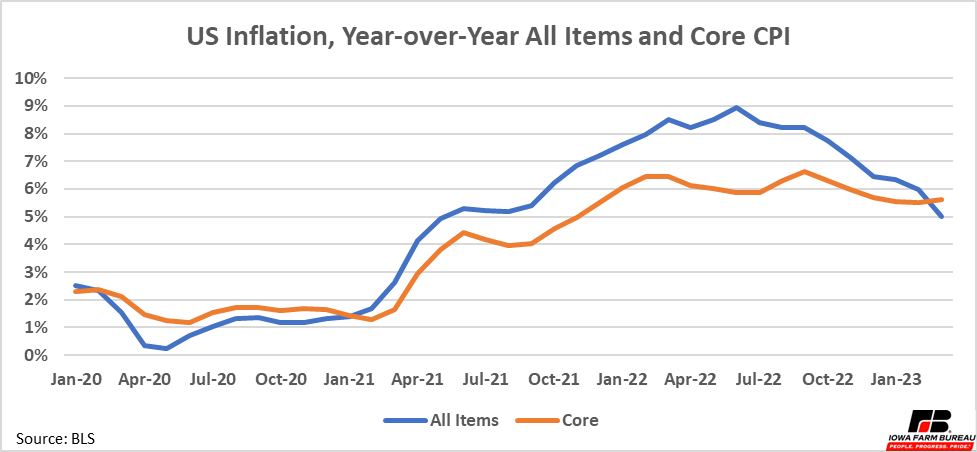
Figure 1. US Inflation, Year-over-Year Total and Core CPI
All-Items vs. Core Inflation
Core inflation excludes changes in food and energy prices. Figure 2 shows the separate food and energy year-over-year inflation rates. All prices are affected by both supply and demand forces, but these two sectors can be affected quickly by these forces and as a result can be more volatile. A reduction in oil supply for example could raise oil prices and make All-Items inflation look higher than it should be to reflect the economy’s inflation.
Current oil prices are a good example of energy large supply and demand forces moving prices more than inflation. The energy CPI weas lower in March on both a month-to-month and year-over-year basis. This helped the All-Items CPI decrease relative to previous months. However, this decrease may be short lived. OPEC recently announced oil production cuts that have already pushed energy markets higher in April and will likely offer support to energy markets going forward as well. This swing in energy prices will likely pull all-items inflation up again next month.
Additionally, recall last year energy prices were relatively high in part due to the Russian invasion of Ukraine. Moving forward, year-over-year calculations will be comparing this year’s prices with prices last year that had a war premium included in its price. The price shock from the invasion has been reduced since last year. Compared to last year’s price, one would expect energy prices will have decreased year over year, simply due to a smaller war premium in the price of crude oil and other energy sources. This volatility is why core inflation is typically more telling of the economy’s inflation than All-Items inflation.
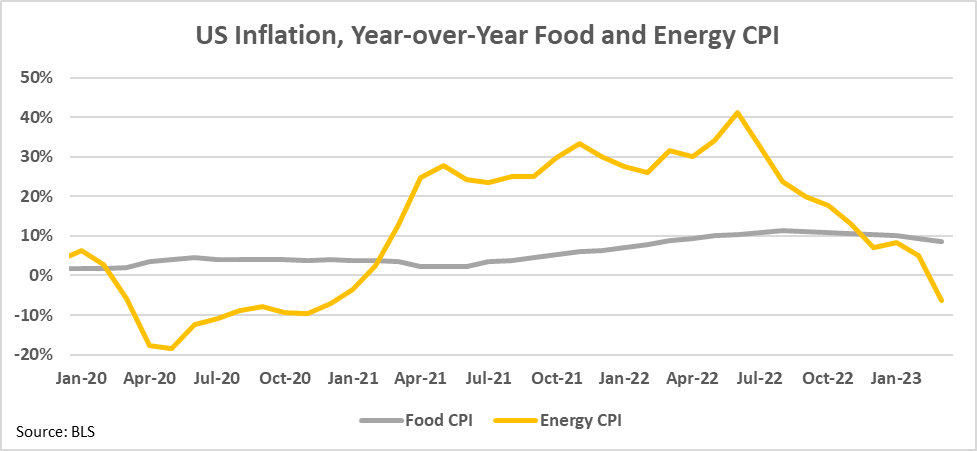
Figure 2. US Inflation, Year-over-Year Food and Energy CPI
Change in Retail Prices: Low, Medium, and High
While in aggregate prices are increasing, not all prices are rising. Some sectors, like the energy sector, have lower prices relative to last year. Figure 3 shows some select items that have increased the most, the least, and some that have shown virtually no change since last year.
Despite egg prices coming down over the past few months from winter highs, retail prices remain well above prices last year as HPAI continues to impact the flock. Airline fares have also had large price increases. Despite lower energy prices, airline fares and transportation services in general have seen relatively large increases in price over the past year.
Medical care as measured by the CPI has only seen small growth in prices year-over-year. Fresh fruits and vegetables and pork are also at retail prices like last year.
Gasoline and fuel oil were among products that saw the largest decrease year-over-year. As discussed earlier this is somewhat expected given last year’s prices and may not last due to OPEC’s expected production cutbacks. Another large decrease was in the price of used cars and trucks. After prices soared during the pandemic, they have come down substantially. As an aside, new vehicle prices increased 6% year-over-year, though this is not shown in Figure 3.
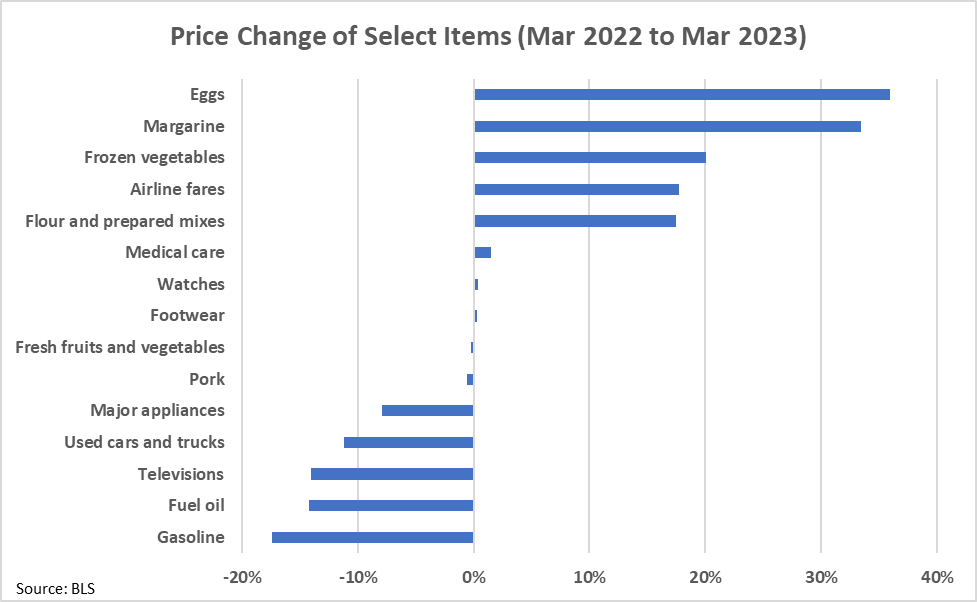
Figure 3. Change of Select Items (Mar 2022 to Mar 2023)
Change in Commodity Prices
Changes in commodity prices are also mixed. Figure 4 shows the year-over-year price changes of various agricultural commodities. Eggs and cattle have seen the largest increases in price while hogs, milk, and wheat are all down. Like energy, these commodities are also affected by supply and demand changes. Eggs and beef for example are up significantly in part due to lower supplies of both products. HPAI continues to impact the US flock, which in turn limits egg production. HPAI only began last February and had not yet begun impacting egg prices a year ago. Similarly, the US beef herd is entering a contraction cycle with the herd continuing to fall, offering upward pressure on prices.
Other commodities like soybeans and wheat have seen little movement relative to a year ago. The Russia invasion of Ukraine and tight stocks together made supply especially tight last summer. While stocks for all commodities are still relatively tight, removing world supply chain issues caused by the Russia invasion has alleviated prices.
Keep in mind products at the end of the supply chain, which the CPI measures, typically have much smaller price movements than products at the beginning of the supply chain. For example, the price of flour is not as volatile as the price of wheat. So price movements in commodities do not have much impact total inflation, even all-items inflation.
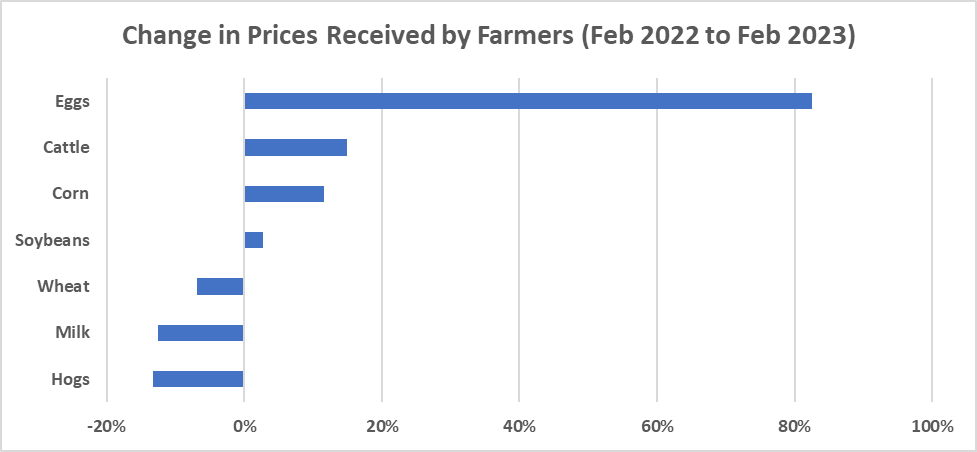
Figure 4. Change in Prices Received by Farmers (Feb 2022 to Feb 2023)
Fed’s Past and Expected Movements
The federal reserve remains committed to getting inflation back to its goal of 2% year-over-year. Consistent rate increases over the past year have shown this commitment, with rates rising 4.75% in just a little over a year (Table 1).
Table 1. Federal Reserve Interest Rate Actions by Meeting
The sudden failure of two US banks did not prevent the Fed from raising rates 0.25% at its last meeting. Core inflation remains high, and the labor market still looks relatively strong. New unemployment claims have been slightly higher in March and April than they were most of 2022 and both the growth of new jobs and available open positions have slowed slightly as well. But non-farm job openings still exceed the number of people unemployed (Figure 5). In February there were about 1.7 jobs available for every unemployed person seeking employment, so employers are still seeking workers. March job openings data have not yet been released.
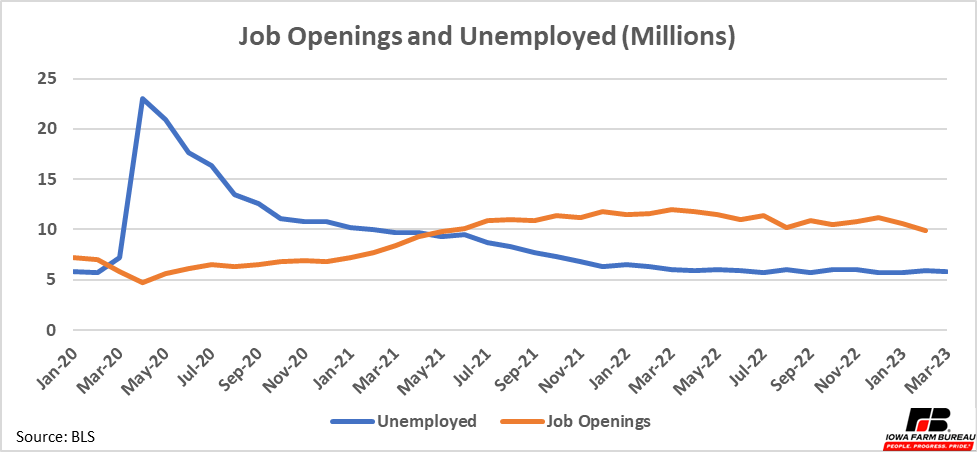
Figure 5. Job Openings and Unemployed (Millions)
Want more news on this topic? Farm Bureau members may subscribe for a free email news service, featuring the farm and rural topics that interest them most!