January 2023 World Agricultural Supply and Demand Estimates Update
Published
1/13/2023
Introduction
The USDA World Agricultural Supply and Demand Estimates (WASDE) report was released on January 12, 2022. For both corn and soybeans ending stocks were lowered as production cuts were larger than use cuts for both crops. Markets for both corn and soybeans moved higher following the news of tighter supplies.
Corn Supply and Demand
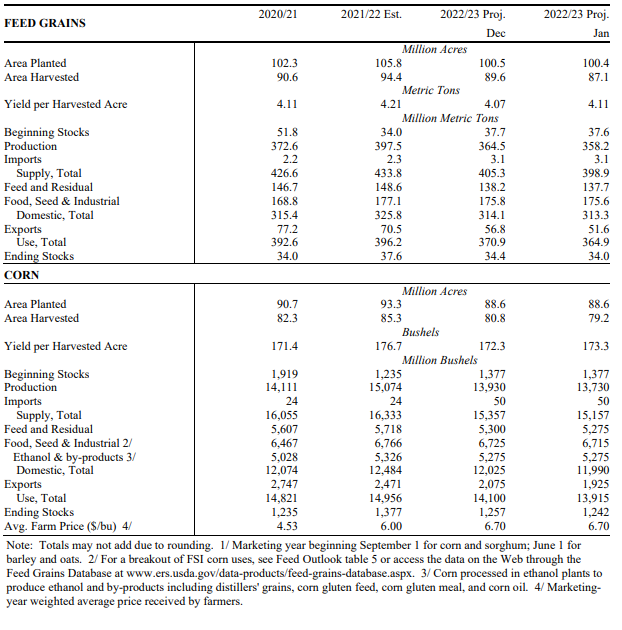
Table 1 shows the January WASDE US feed grains and corn estimates.
On the supply side, corn production was reduced 200 million bushels. This reduction was a result of a reduction in harvested acres. Drought, especially in the plains states likely contributed to the acreage reduction through more failed acres and abandonment than expected.
On the demand side, both feed & residual use, food, seed, & industrial use, and export estimates were lowered while ethanol use estimates were left unchanged. Total use reductions totaled 185 million bushels. With total production cuts higher than total use cuts, estimated ending stocks fell 15 million bushels.
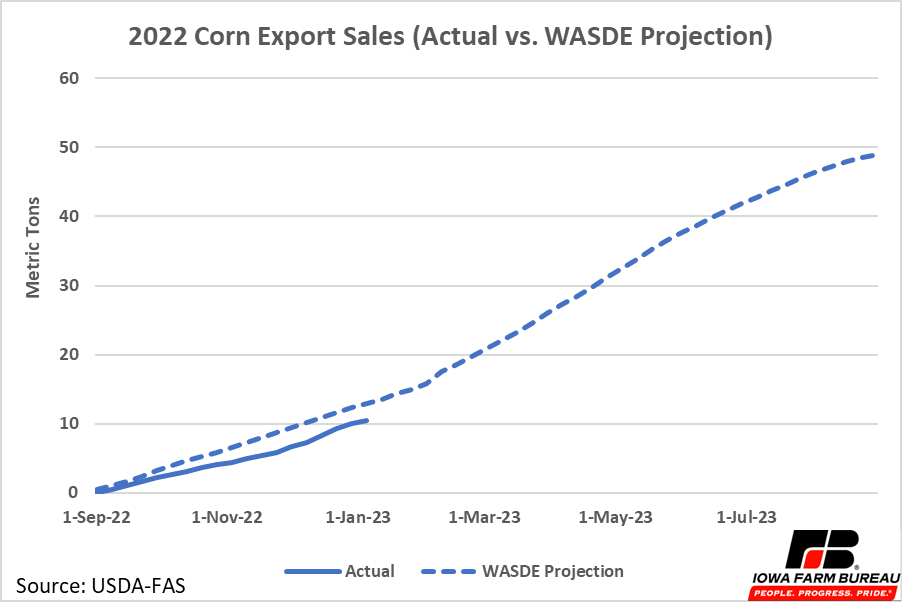
Corn exports will be important to monitor moving forward. Using previous years’ sales data and the annual WASDE corn export estimate, weekly corn export sales were projected (Figure 1). Even with the reduced export estimate, corn export sales are still behind projections. The high dollar index and high shipping costs on the Mississippi at the beginning of the marketing year likely contributed to this year’s slow start to export sales. Barge rates on the river have come down paving the way for increases in export shipments from the Gulf during late winter and into spring.
Higher than expected sales during some of the months remaining in this marketing year will be needed to meet the export estimate. If exports continue to lag expectations, corn prices could face some downward pressure in the future. Prices for petroleum-based products could also factor in to future demand for ethanol. The current estimated use of corn for ethanol is for about a 1% reduction compared to the prior marketing year. If fuel prices stay near where they currently are, the projection seems in line, but if crude oil and gasoline prices start to move higher (say back above $90 crude), then the ethanol production numbers could increase compared to the current estimates.
Table 1. January 2023 WASDE Feed Grains and Corn Tables


Figure 1. 2022 Corn Export Sales
Soybean Supply and Demand
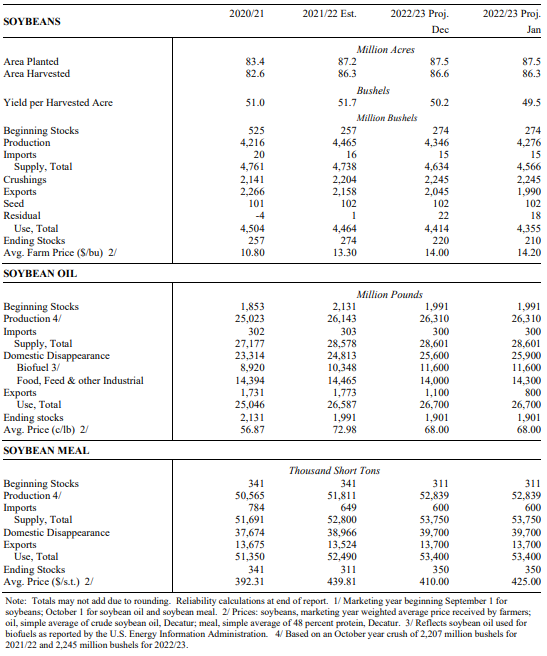
Table 2 shows the January WASDE US soybean and soy products estimates.
Soybean production was reduced on lower yields and acres harvested. In total, soybean production was reduced 70 million bushels from the November estimate.
On the demand side, total use was reduced 60 million bushels. The bulk of the reduction was due to reduced export forecasts as crush and seed use was unchanged and residual use was only slightly reduced.
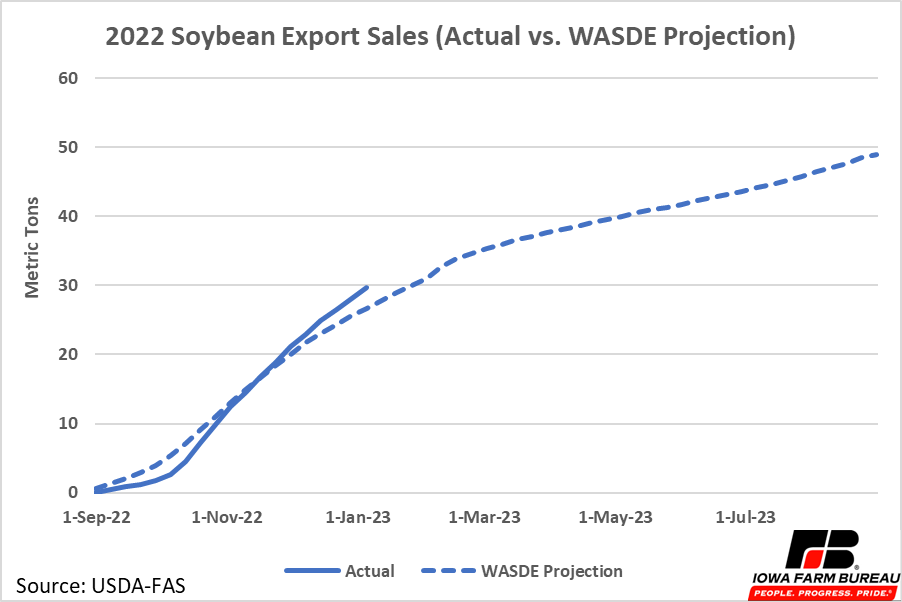
Like corn, the soybean export estimate was also adjusted down. Figure 2 shows projected soybean exports based on historical sales and expected annual exports. Soybean export sales also had a slower than usual start to the year. However, the reduction in expected exports, and stronger sales over the past few weeks, put soybeans on track to meet the current export estimate.
Soybean crush rate is the other variable to watch in the coming months. While a spike in soybean oil prices such as was seen last year is not expected to happen in 2023, if there is strength in the crude oil and/or diesel fuel prices, then crushing for soybean oil could provide an upward boost to soybean demand and soybean prices.
Table 2. January 2023 WASDE Soybean and Soy Products Tables


Figure 2. 2022 Soybean Export Sales
Economic analysis provided by Aaron Gerdts, Research Analyst, Decision Innovation Solutions on behalf of Iowa Farm Bureau.
Want more news on this topic? Farm Bureau members may subscribe for a free email news service, featuring the farm and rural topics that interest them most!