Record Yields, Acreage Shifts Projected in August 2025 WASDE Report
Author
Published
8/20/2025
Introduction
USDA released the August crop report as well as an updated WASDE report on August 12th, 2025. The crop report was a bit of a shocker to say the least. Corn acreage was increased by roughly 2 million acres, and national corn yield soared to an all-time high of 188.8 bushels per acre, far outpacing industry expectations. The prior U.S. record corn yield was 179.3 bushels per acre set just last. This year’s yield is a whopping 9.5 bushels per acre higher than last year’s record yield. With the increase in acreage and the record yield, total corn production is estimated to be 16.742 billion bushels, 1.4 billion bushels greater than the prior record production (15.34 billion bushels) set in 2023.
The Iowa corn crop is estimated to be 2.884 billion bushels, 248 million bushels greater than last year’s record production. This is on a state-average yield of 222 bushels per acre, topping the all-time record set last year of 211 bushels per acre.
Iowa’s soybean yield is estimated at 63 bushels per acre which would be a new record state yield. Soybean production in Iowa is estimated at 587.8 million bushels which would be the third largest soybean crop in Iowa’s history.
The August WASDE is the first WASDE to incorporate farmer surveys into its yield projections for the current year, making it more reflective of real-world conditions and farmers’ expectations.
Table 1 shows that for the 2024/25 marketing year corn ending stocks decreased by 35 million bushels (mb), soybean ending stocks decreased by 20 mb, but wheat ending stocks stayed constant at 851 mb.
World ending stocks for the 2024/25 marketing year experienced minor changes, with corn and wheat ending stocks decreasing by 1.07 million metric tons (MMT) and 0.89 MMT respectively. Soybean ending stocks slightly increased by 0.07 MMT to 125.19 MMT.
U.S. corn ending stocks for the 2025/26 marketing year surged, increasing by 457 mb to 2,117 mb. Soybean and wheat ending stocks both decreased by about 20 mb to 290 mb and 869 mb respectively. Corn ending stocks were higher than the average trade expectation by 217 mb. Soybean ending stocks are 61 mb less than trade analysts’ estimates and wheat ending stocks are 13 mb less than estimates.
World corn, soybean, and wheat ending stocks all decreased for the 2025/26 marketing year by 3.16 MMT, 1.17 MMT and 1.24 MMT respectively. Corn and soybean ending stocks underperformed even the minimum trade analysts’ expectations. Wheat ending stocks were only 1.24 MMT less than the average analyst’s estimates.
Total wheat production estimates decreased by 2 mb to 1,927 mb, but outperformed expectations by 7 mb. Hard red winter wheat (HRW) and soft red winter wheat (SRW) production estimates increased by 14 mb and 2 mb respectively. White winter wheat decreased by 7mb to 282 mb. HRW, SRW, and white winter wheat exceeded trade expectations by 12 mb, 2 mb, and 29 mb respectively.
Table 1 shows key report estimates along with trade analyst expectations.
Table 1. August 2025 USDA WASDE vs Market Expectations
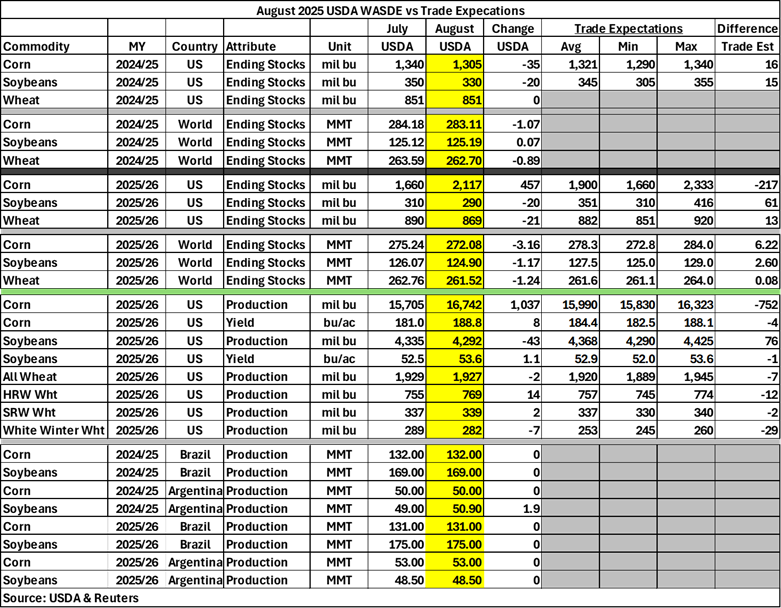
The only change for Brazil and Argentina corn and soybean production estimates for the 2024/25 marketing year is that Argentina soybean increased by 1.9 MMT. Brazil and Argentina corn and soybean production estimates remain unchanged from July to August for the 2025/26 marketing year.
Initial Market Reaction
Prior to the WASDE report releasing, corn was down 5 cents, soybean down 14 cents, and wheat down 6 cents. Ater the report was released, prices continued to change. September corn futures dropped from $3.80 to $3.72 immediately and continued to fall throughout the day. December corn futures followed a similar trend, falling from $4.03 to $3.95 initially. March corn futures decreased from $4.20 to $4.13 before continuing to decrease through the afternoon.
Soybean futures responded positively to the WASDE report, partially due to estimated supply falling. August soybean futures quickly increased by 30 cents to $10.04. September soybean futures rose by 35 cents to $10.12 and November soybean futures increased by nearly 40 cents to $10.32.
August soybean meal futures rose from $274.4/ton to $283.1/ton before dropping back to $279.3/ton. September soybean meal futures rose by $10/ton to $287.2/ton before closing at $281.3/ton. October soybean meal futures initially increased by $11/ton to $290.2/ton before falling back to $284.5/ton.
August soybean oil futures steadily increased to 52.72 cents. September soybean oil futures initially increased from 52.25 cents to 52.91 cents. October soybean oil futures rose from 52.08 cents to 52.79 cents and continued to rise throughout the day.
September and December wheat futures both initially fell by 4 cents to $5.04 and $5.25 respectively. March wheat futures decreased by 3 cents to $5.44.
Changes to Domestic Balance Sheets
This section summarizes changes to the corn and soybean balance sheets in more detail.
For corn in the 2024/25 marketing year, food, seed, and residual decreased by 35 mb which leads to a 35 mb decrease in total domestic. Ethanol declined by 30 mb to 5,470 mb and total use increased by 35 mb to 15,350 mb. Ending stocks dropped by 35 mb to 1,305 mb and the average farm price per bushel remains unchanged at $4.30.
For the 2025/26 marketing year, acreage planted and harvested increased by nearly 2 million acres each to 97.3 million acres and 88.7 million acres respectively. Yield per harvested acre improved by 7.8 bushels per acre to 188.8 bushels per acre. Beginning stocks fell by 35 mb to 1,305 mb and production surged to 16,742 mb, an increase of 1,037 mb. These changes result in total use growing by 1,002 mb to 18,072 mb. Feed and residual rose by 250 mb and food, seed, and industrial increased by 95 mb, leading to a 345 mb boost to total domestic. Ethanol increased by 100 mb to 5,600 mb. Exports rose by 200 mb, which combined with the change in total domestic results in a 545 mb increase to 15,955 mb. Ending stocks increased by 457 mb to 2,117 mb and expected average farm price dropped by 30 cents to $3.90.
Table 2. August 2025 WASDE Corn Balance Sheet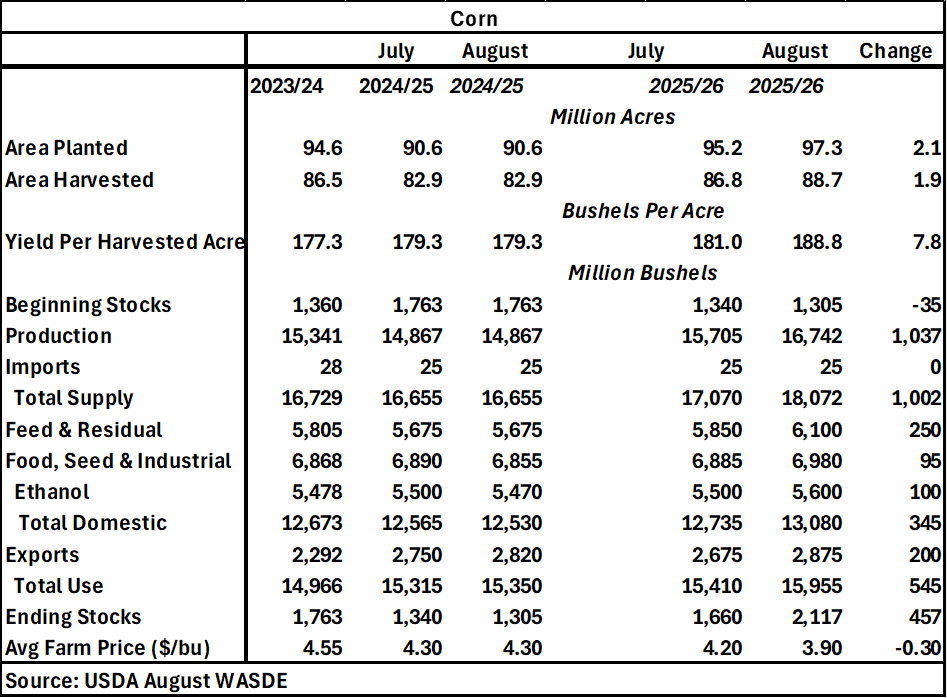
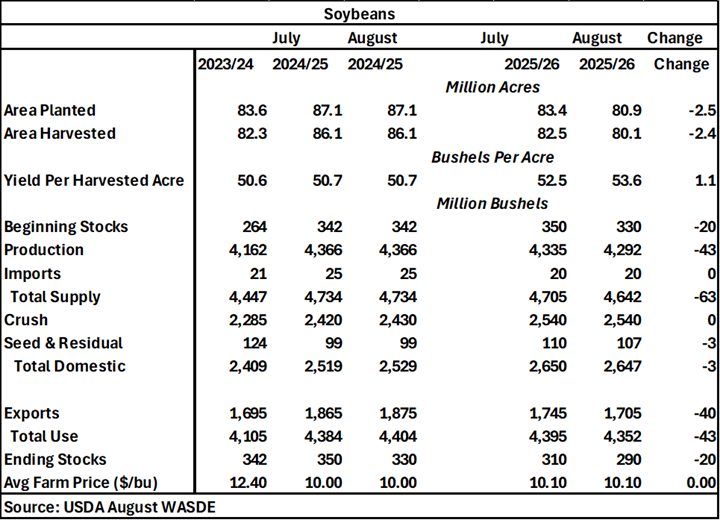
For soybeans in the 2024/25 marketing year, crush increased by 10 mb, leading to a 10 mb increase in total domestic to 2,529 mb. Exports increased by 10 mb to 1,875 mb. These increases lead to total use rising by 20mb to 4,404 mb. Ending stocks fell by 20 mb and the expected average farm price remain unchanged at $10.00 per bushel.
For the 2025/26 marketing year, acreage planted decreased by 2.5 million acres to 80.9 million acres and acreage harvested decreased by 2.4 million acres to 80.1 million acres. Yield harvested per acre improved by 1.1 bushels per acre to 53.6 bushels per acre. Beginning stocks fell by 20 mb to 330 mb and production fell by 43 mb to 4,292 mb. These changes result in total supply decreasing by 63 mb to 4,642 mb. Seed and residual decreased by 3 mb leading to total domestic also decreasing by 3 mb. Exports dropped by 40 mb to 1,705 mb. The change in total domestic usage and exports leads to total use decreasing by 43 mb. Ending stocks fell by 20 mb and the expected average farm price remains unchanged at $10.10 per bushel.
Table 3. August 2025 WASDE Soybean Balance Sheet
Want more news on this topic? Farm Bureau members may subscribe for a free email news service, featuring the farm and rural topics that interest them most!