Iowa commodity production and movement of commodities
Author
Published
1/25/2023
Iowa Commodity Production and Movement of Commodities
Iowa produces lots of agricultural commodities. In 2017, it was estimated that Iowa produced more than 163 million tons of agricultural commodities (including commodities produced from first point of processing such as soybean meal, soybean oil, ethanol, and dried distillers grains (DDGs), biodiesel, pork, beef, and animal byproducts. Table 1 provides an estimate of the total tonnage of the major agricultural commodities produced in Iowa in 2017.
Table 1. Iowa Commodity Production, 2017 (Tons)
 These commodities move from farm to first collection and processing mostly by truck, but also move from there back to farms by trucks, and many of these commodities move by rail, truck and rail, and truck and barge to locations in other states and to points of export. This article reports on the movement of these commodities.
The Bureau of Transportation in conjunction with the U.S. Census Bureau and the Department of Commerce conducts a survey every 5 years on the movement of products from designated sub-areas to designated sub-areas of the United States. The survey is the primary source of national and subnational level data on domestic freight shipments by establishments in mining, manufacturing, wholesale, auxiliaries, and selected retail and services trade industries located in the 50 states and the District of Columbia. Data are provided on the type, origin and destination, value, weight, modes of transportation, distance shipped, and ton-miles of commodities shipped. The CFS is conducted every 5 years as part of the Economic Census. It provides estimates of national freight flows for all modes of transportation and is the only publicly available source of commodity flow data for the truck mode. The CFS was conducted in 1993, 1997, 2002, 2007, 2012, and 2017 but the 2017 data was the first to be published on the internet.
The CFS categorizes goods based on Standard Classification of Transported Goods (SCTG) codes. While there are more than 40 codes for classification of goods, the ones in Table 2 highlight the codes that cover agricultural-related goods.
Table 2. Standard Classification of Transported Goods Codes 
Based on the CFS, Table 3 summarizes where Iowa commodities flow based on the CFS survey. The CFS captures the movement of 33.6 million tons of commodity flow out of the approximately 163 million tons of commodities produced in Iowa. While this is useful information, it falls significantly short in fully understanding the movement of Iowa commodities, both in-state and out-of-state.
Table 3. Summary of Out-Shipments of Ag Products from Iowa (Tons)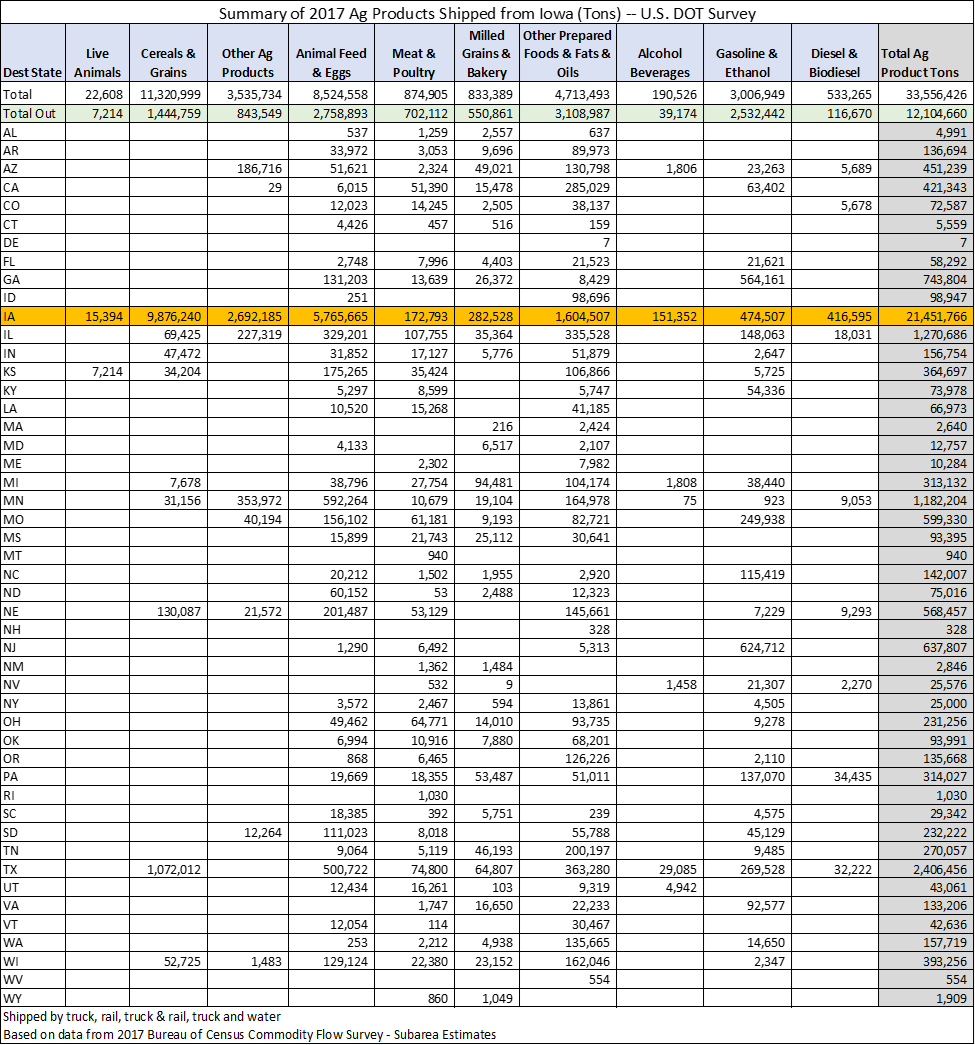
DIS has estimated the in-state and out-of-state flows for 15 commodities produced in Iowa. Table 4 shows the flows of commodities that stay in Iowa, as well as flows to nearby states, other states, and to export points in the Gulf and in the Pacific Northwest (PNW). This data is based on production and flows in 2020. DIS estimates that in 2020 a total of 130.6 million tons were produced of these 15 commodities. Of that production, corn is the leading commodity with more than 73 million tons produced. It is followed by production of soybeans, ethanol, soybean meal, hogs, milk and fed cattle.
Table 4. Summary of Iowa Commodity Production and Outbound Shipments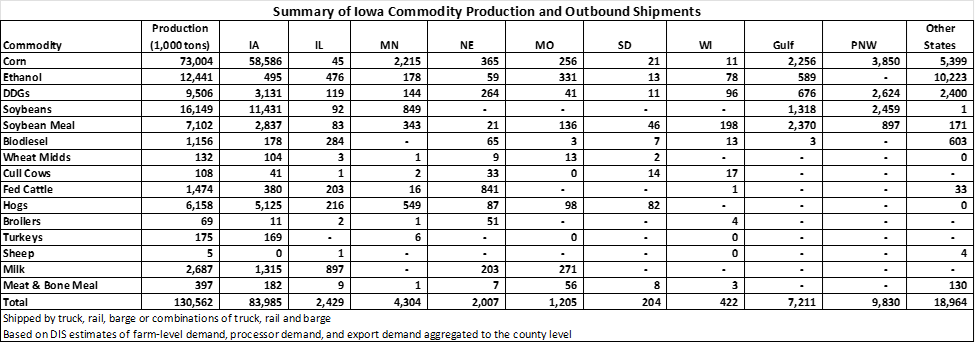
DIS estimates that 64.3% of these commodities remain in Iowa and are used or processed in the state. Exports through the PNW account for 7.5% of the commodities produced in Iowa with corn, DDGs, soybeans and soybean meal being the primary exports through the PNW. Exports to the Gulf ports represent 5.5% of Iowa’s production with soybean meal, soybeans, corn, DDGs, and ethanol being the leading commodities exported through the Gulf. Minnesota is the state that received the most tonnage of Iowa commodities with 3.3% of Iowa’s production moving into Minnesota. Corn, soybeans, hogs and soybean meal are leading commodities shipped to Minnesota from Iowa. Illinois received 1.9% of Iowa’s commodities with milk, ethanol, biodiesel, hogs, and fed cattle being the leading commodities shipped to Illinois from Iowa. Nebraska received 1.5% of Iowa’s commodities with fed cattle, corn, DDGs, and milk being the leading commodities shipped from Iowa to Nebraska. About 14.5% of Iowa’s commodities are shipped to other states that are not broken out in the table.
Economic analysis provided by David Miller, Consulting Chief Economist, Decision Innovation Solutions on behalf of Iowa Farm Bureau.
Want more news on this topic? Farm Bureau members may subscribe for a free email news service, featuring the farm and rural topics that interest them most!