Iowa Ranked #1 Ag Production Per Square Mile
Author
Published
4/27/2017
An often-quoted statistic is that Iowa is one of the top three states for agricultural production in the United States. However, when comparing the amount of agricultural value per square mile within the state, the ranking changes dramatically. Total crop and animal sales per state dispersed across each square mile of the states provides a spatial reference of how the quantity of agriculture occurs within that state based on the size of the state. And, in this case, Iowa leads the nation in Value of Agricultural Sales Per Square Mile.

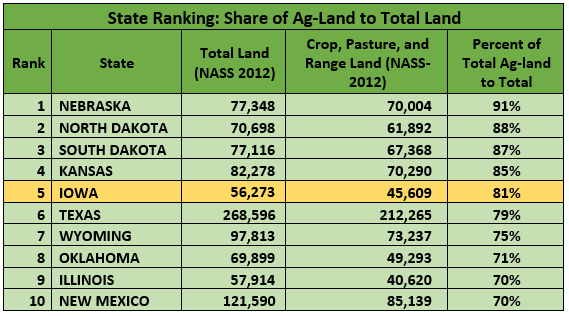
In addition, the amount of crop, pasture, and range land as a share of total state land adds even more depth to this picture. (See Table Below) Although Iowa is not number one in this ranking it remains in the top 5 and adds more understanding to the sheer quantity of agricultural activity that occurs within Iowa. Iowa uses less agricultural land to make more sales in agricultural products than any of the states out ranking it (Nebraska, North Dakota, South Dakota, and Kansas). Moreover, Texas has 4 times more land in agriculture compared to Iowa, yet, Iowa produced $5 billion more in crop and animal sales in 2012. All things considered, Iowa has a strong agricultural tradition, and an impressive proclivity for working the land. Furthermore, Iowa maintains such high volumes of production through strong conservation techniques and implementation of agricultural technology.
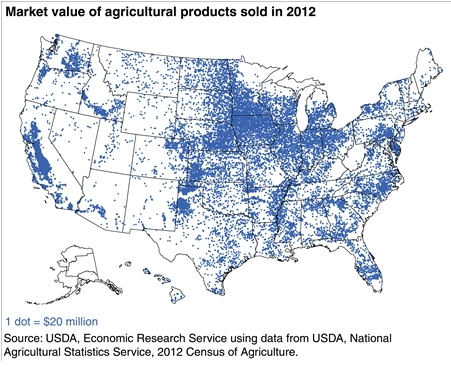
Finally, the following map produced by the U.S. Department of Agriculture’s Economic Research Service provides a valuable visual representation of the concentration of agricultural production by dollar value.
Preston Lyman is a Research Analyst with Decision Innovation Solutions (DIS). DIS is an Iowa-Based economic research firm which provides regular farm economics research and analysis to the Iowa Farm Bureau staff and members.
Want more news on this topic? Farm Bureau members may subscribe for a free email news service, featuring the farm and rural topics that interest them most!