Commodity Prices vs. Inflation
Author
Published
12/30/2022
Inflation has impacted many areas of the economy over the past two years. Figure 1 shows year-over-year inflation of the core CPI. “Normal” inflation is around 2%, which is where inflation sat for most of the past decade. In April 2021, inflation hit 3.0%. Inflation continued up and still sits at a relatively high level.
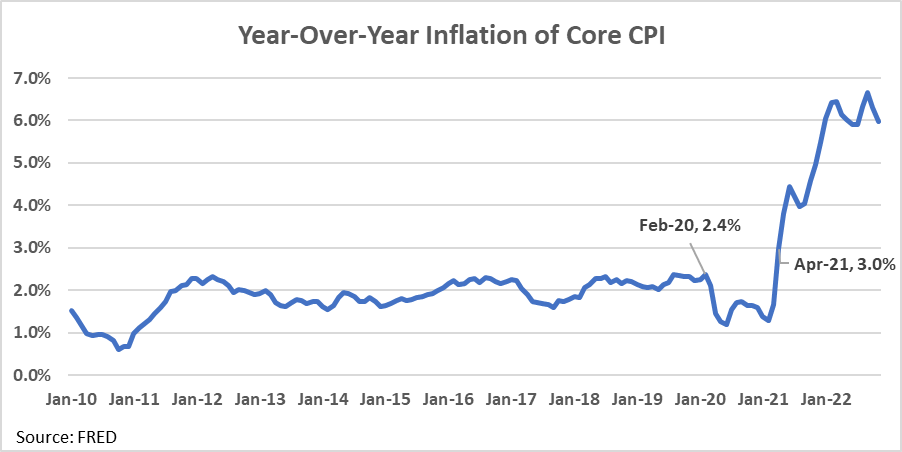
Figure 1. Year-Over-Year Inflation of Core CPI
Commodity prices also increased dramatically over the last two years. An often-asked question is how close have they kept up with inflation. In addition to inflation, many supply and demand factors effect commodity prices, causing them to move up and down. A simple way to compare commodity prices to inflation is by using indexes. An index measures the change in the price over time relative to a certain reference point.
For this comparison the reference point is February 2020, just prior the pandemic. This adjusts prices to pre-pandemic levels and shows changes in prices caused by the pandemic and inflation following the pandemic.
Figure 2 and Figure 3 show indexes for core CPI and the prices of major commodities relative to February 2020. Figure 2 contains commodities that consistently stayed above core inflation, while Figure 3 shows commodities that started out below core CPI inflation.
Commodities in Figure 2 include soybeans, retail beef, and retail pork. Soybeans were slightly below the core CPI early in the pandemic but now sit well above inflation. Retail beef and pork have consistently stayed above inflation. Retail beef and pork are further down the supply chain and while considered commodities have significant processing and handling expenses incorporated into their prices. Items further down the supply chain typically are not as volatile and more closely follow core CPI.
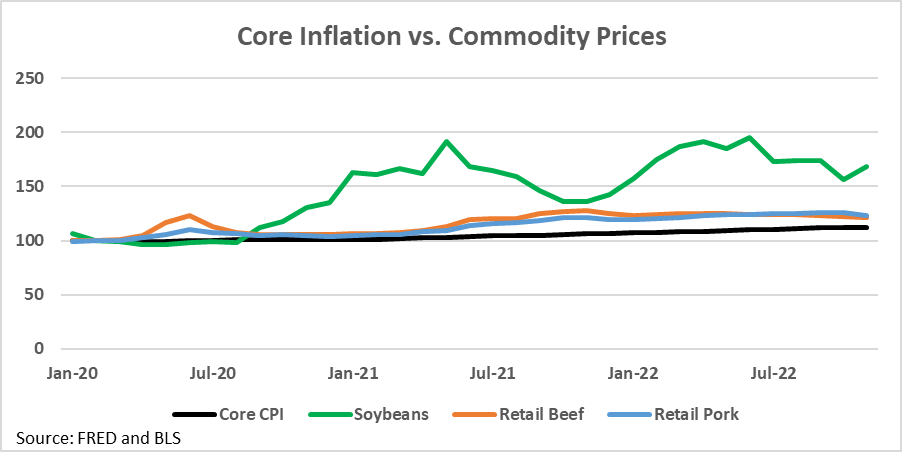
Figure 2. Inflation vs. Commodity Prices
Figure 3 contains commodities that early in the pandemic sat below inflation. Commodities here are corn, cattle, hogs, and ethanol. While all these commodity prices initially deflated near the beginning of the pandemic, they have since increased faster than the rate of inflation. All these commodity price indexes were higher than retail beef and retail pork in November, which means all have increased in price more than retail beef and pork relative to the start of the pandemic.
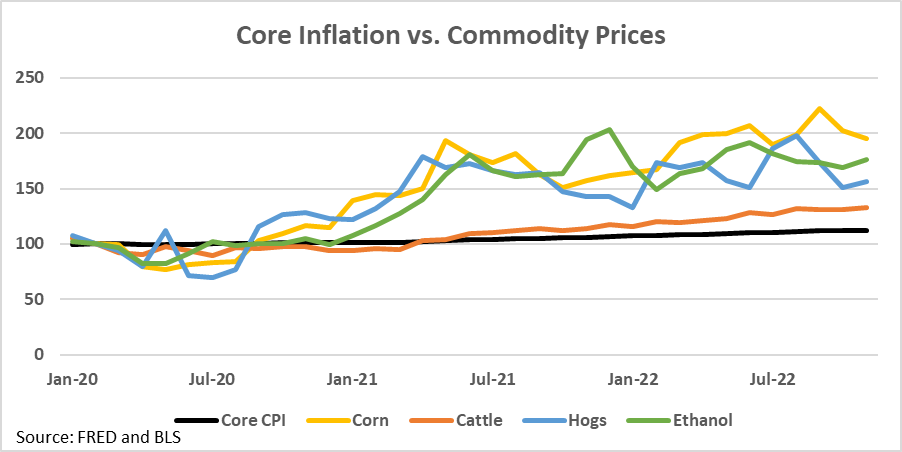
Figure 3. Inflation vs. Commodity Prices
Considering only changes in prices, commodity prices have increased more than core inflation. It is important to note this simple analysis only looks at the rate prices have increased. Other factors that cause commodity prices to increase like changes in production are not accounted for. For example, consecutive years of tight ending stocks for both corn and soybeans would have likely caused prices to increase regardless of inflation.
However, just as commodity prices have increased much faster than inflation, the price of major inputs has also increased faster than inflation. Corn and soybean are major feed inputs for cattle and hogs, and both feeds have increased in price faster than the livestock they are fed too. Figure 4 shows the index for the price of corn as well as major inputs including fertilizer, pesticides, machinery, machinery maintenance, and non-real estate loans.
Corn has done a good job increasing in price faster or about equal to the cost of most major inputs. Fertilizer is the only input in the graph below that has increased at a faster rate than the price of corn. This means that despite high input costs; corn was more profitable in the past two years as it increased in price faster than its inputs.
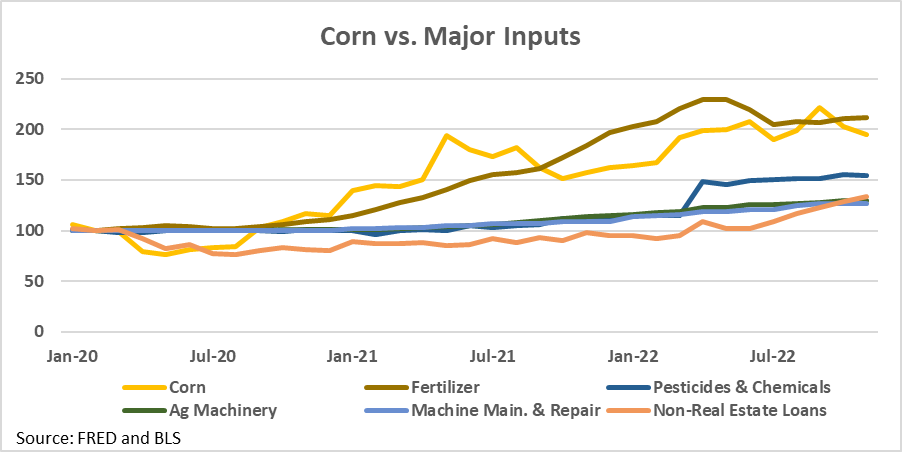
Figure 4. Corn vs. Major Inputs
Commodities are historically volatile but also typically a good hedge against inflation. Figure 2 and Figure 3 show that this has continued to be true. All major Iowa agricultural commodities increased in price at a faster rate than inflation over the past two years. Furthermore, to this point, corn and soybeans have increased in price at faster rates than most of their inputs, which kept them profitable over the past two years.
It is not a guarantee that this will continue moving forward. Notably, interest rates were not elevated for most of 2021 and 2022. The index just began increasing in the second half of 2022 as seen in Figure 4. Interest rates will likely continue to increase into 2023 as the Fed continues to battle inflation.
Furthermore, land prices and cash rent are not included above. Iowa land prices have increased about 55% from December 2019 to December 2022. This is well above the inflation rate though still slower than the rate corn and fertilizer increased at the same time. Cash rent values are likely to follow these land values up, especially into 2023 as interest rates have climbed. Landowners renting out land may seek higher returns to match higher interest rates.
Finally, as mentioned earlier, commodities have many other factors that effect their prices besides inflation. A record crop or weaker demand could easily move commodity prices down again.
Economic analysis provided by Aaron Gerdts, Research Analyst, Decision Innovation Solutions on behalf of Iowa Farm Bureau.
Want more news on this topic? Farm Bureau members may subscribe for a free email news service, featuring the farm and rural topics that interest them most!