China's economy struggles: How might U.S. farmers be impacted?
Author
Published
9/12/2023
While China’s economy is not in a recession, it appears to be stumbling. Data releases and reporting from China over the past several weeks indicate that the Chinese economy is facing challenges from several different directions. Real estate demand is slowing, and many apartments are sitting unoccupied. More than a decade of heavy investment into construction and infrastructure has resulted in high debt levels. The Chinese government suspended the publication of its official youth unemployment rate after it climbed to a high of 21.3%. All of these factors and more led China’s central bank to cut interest rates in an attempt to boost its economy.
Even aside from its current economic woes, China’s economy has been gradually cooling in recent years. Figure 1 shows China’s annual growth in gross domestic product (GDP) since 2000. After rising to a high of more than 14% in 2007, China’s annual growth has since been trending downward. Annual growth has not been above 8% since 2011. After recovering from the pandemic in 2021, China’s economy grew by only 3% in 2022.
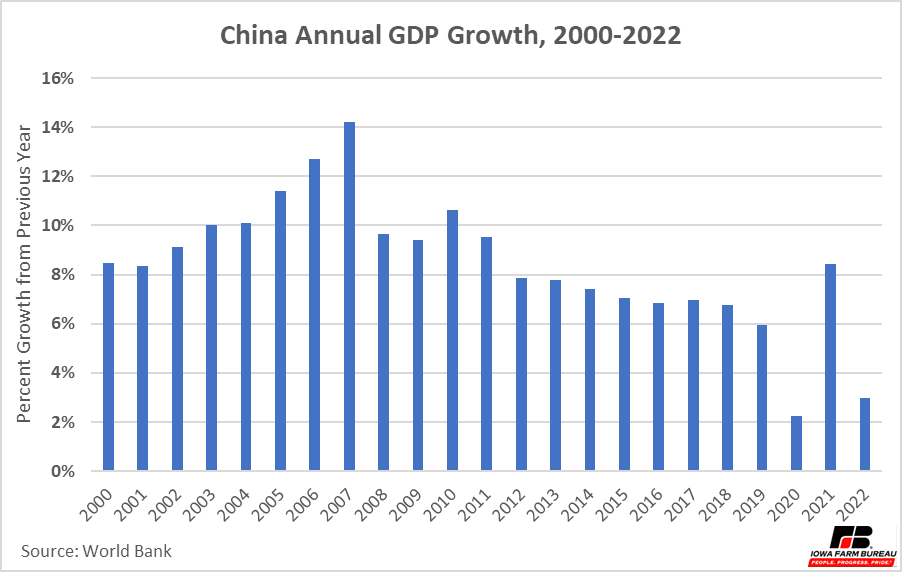
Figure 1. China Annual GDP Growth
Despite trade disruptions in recent years and some pushes to “decouple” the two economies, China remains a very important trading partner for the United States. As shown in Table 1, in 2022 China was the number one overall importer of agricultural goods from the U.S. It was the number one importer for three categories (including oilseeds, which make up nearly half of all U.S. exports to China by value) and in the top ten importers for all categories with the exception of non-beverage ethanol.
Table 1. 2022 U.S. Agricultural Exports to China
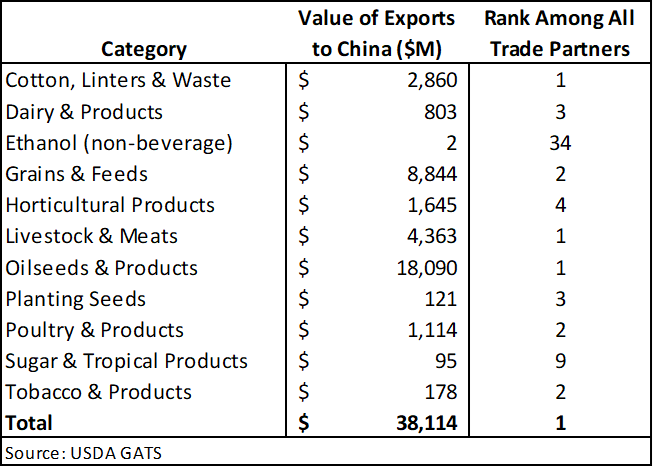
Figure 2 shows China’s annual GDP plotted with its annual agricultural imports from the United States. As China’s GDP has grown from $1.2 trillion in 2000 to nearly $18.0 trillion in 2022, its imports of agricultural products from the U.S. have grown from $1.7 billion to $38.1 billion. The two measures over this time period have a correlation coefficient of 0.84, indicating that they are highly correlated. Imports relative to GDP decreased substantially in 2018 and 2019 due to the trade conflict between the two countries, but imports have returned to the “trend” indicated by GDP in the years since.
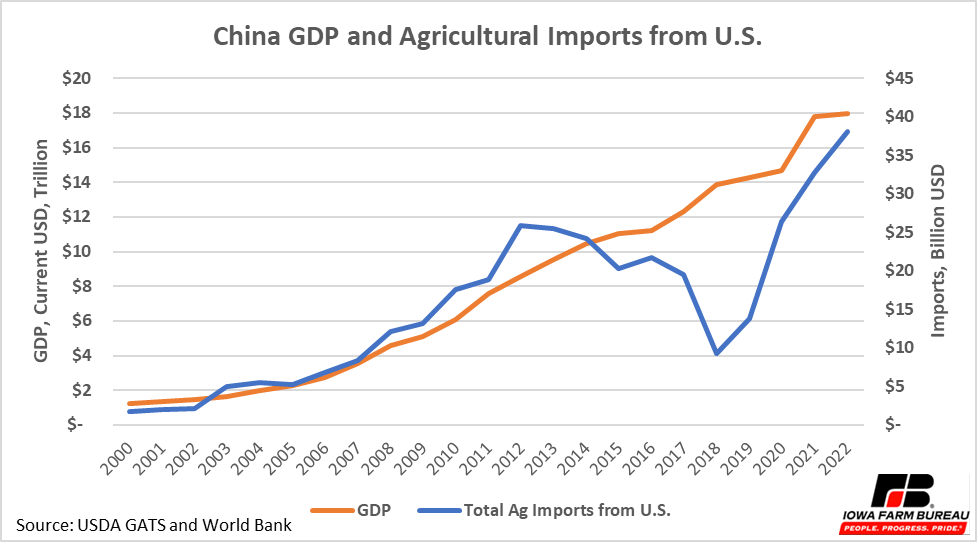
Figure 2. China GDP and Agricultural Imports from the U.S.
While determining the causality of this relationship is outside the scope of this article, it is clear that as China becomes wealthier, it tends to buy more agricultural products from the United States. With China’s GDP growth decelerating from its previously very high levels, the growth rate of its imports from the U.S. may also begin to decline. And should China’s current economic challenges prove sufficiently disruptive and cause its economy to shrink, their effects may also be felt by farmers in the United States.
Want more news on this topic? Farm Bureau members may subscribe for a free email news service, featuring the farm and rural topics that interest them most!