China’s Announced 10 Percent Ethanol-Gasoline Blending Rate: Opportunities for U.S. Corn Exports?
Author
Published
11/16/2017
China is the fourth largest producer and consumer of ethanol after the United States, Brazil, and the European Union. China’s ethanol gasoline blend rate averaged 2.6 percent from 2008 to 2016, with ethanol consumption ranging from 594 million gallons in 2008 to 1.010 billion gallons in 2016.
Based on data from USDA-Foreign Agricultural Service (FAS) GAIN report, China: Biofuels Annual, published February 7, 2017, the 2017 outlook for China’s ethanol production, consumption, and imports indicates volumes of 938 million gallons, 1.017 billion gallons, and 79 million gallons, respectively. Ethanol production and consumption are expected to increase 12.5 and 0.7 percent year-over-year. China’s 2017 ethanol production increase is being boosted by strong demand, large feedstocks, and government support. Due to higher applied duties for imported ethanol and expanding domestic supplies, China’s 2017 fuel ethanol imports are expected to decline 64.8 percent compared with 2016. China’s ethanol import duties in 2017 is 30 percent compared with the previously applied preferential rate of 5 percent. In 2016, two provinces (Jiangsu and Hebei) adopted a 10 percent ethanol blend with gasoline (E10) mandate. In addition to these two provinces, by February 2017 China had launched an E10 mandatory pilot program in 11 provinces and 40 municipalities. The pilot program’s locations were chosen based on the proximity to grain production areas. At that time there were no proposals for a country-level blending mandate.
China Announced E10 Nationally by 2020
Reuters news reported on September 13, 2017, China’s plans to increase the ethanol gasoline blending rate to 10 percent nationally by 2020. China’s gasoline consumption forecast for 2020 indicates a volume of 46.588 billion gallons. Considering a 10 percent ethanol-gasoline blending rate and assuming corn as the only feedstock used, 4.659 billion gallons of ethanol would be consumed in China by 2020. Assuming a conversion rate of 2.8 gallons of ethanol per bushel of corn, 1.664 billion bushels of corn would be required to meet the 2020 ethanol consumption. In terms of production capacity, China would need to expand its investment in ethanol plant capacity in order to achieve this higher ethanol blend. According to the USDA-FAS’s China: Biofuels Annual report published in February 2017, current production capacity, in 2016 was equal to 951.1 million gallons and forecast at 1.109 billion gallons in 2017, for a capacity use of 88 percent in 2016 and 85 percent in 2017. By 2020 China’s ethanol production capacity would have to increase about 320 percent from the 2017 projected level.
China Corn Stocks
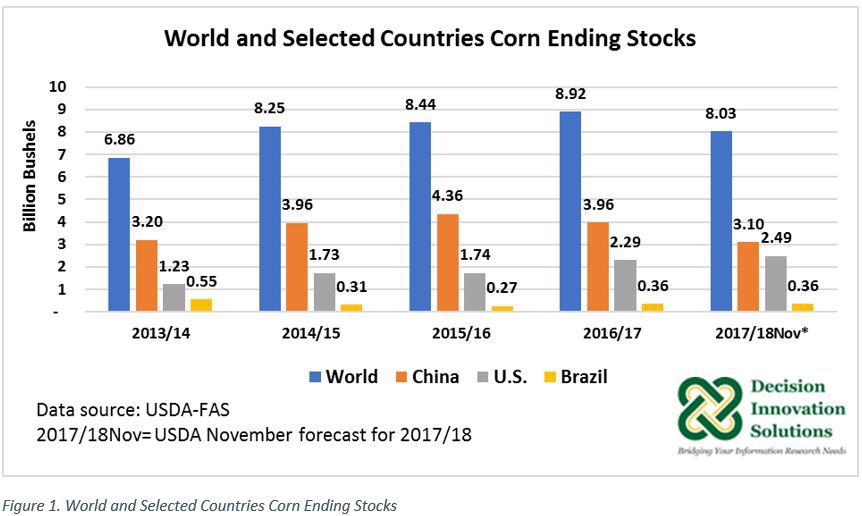
As Figure 1 indicates, China has the largest corn stocks in the world. On average, from 2013/14 to 2016/17 China’s corn stocks (3.871 billion bushels) represented 47.7 percent of world corn stocks (8.117 billion bushels, on average). China’s corn stocks piled up during the time of policy price support for corn producers, which ended in 2016 and left China’s corn producers with some of the highest corn cost of production in the world (USDA-FAS GAIN report China: Grain and Feed Annual published April 4, 2017).
As reported in a USDA-FAS publication (China-Reform Continues in the Corn Sector, September 2017), China’s state media indicated the adoption of E10 will address the issues related to excessive corn stocks and air pollution. China is trying to reduce its substantial stocks of high-priced domestically produced corn through the implementation of policy oriented to support higher domestic use from processors and end users. Moreover, China has moved from food security programs that centered on staple grains and is considering a feed security program based on a basket of products. China has formulated several stimulus programs that encourage farmers to diversify production. The November 2017 edition of the USDA-FAS’s Grain: World Markets and Trade report indicates 2017/18 China corn production and corn ending stocks are forecast to decline 2.1% to 8.464 billion bushels and 22% to 3.097 billion bushels, respectively, from the previous marketing year (see Figure 1). Based on trade data, China’s 2016/17 corn imports (from all sources) were revised in the latest (November 2017) USDA-FAS’s Grain: World Markets and Trade report. 2016/17 corn imports were reduced from the previous’ month estimate of 118 million bushels to 97 million bushels. The November forecast for 2017/18 corn imports remained the same as the October 2017 forecast at 118 million bushels.
The U.S. export sales published by USDA-FAS November 9, 2017, indicate during the first nine weeks of the 2017/18 marketing year, China’s total commitments (accumulated sales + outstanding sales) reached a volume of 4 million bushels, representing less than 1 percent (0.5 percent) of total commitments from all countries (763 million bushels).
China’s corn import demand may remain stagnant given the country’s large corn stocks. Once China reduces its corn stocks, China’s corn import demand could be boosted to avoid finding itself tight in corn. China is forecast to consume about 50.626 billion gallons of gasoline by 2024. Assuming corn as the only feedstock in ethanol production, a 10 percent ethanol blending would require 5.063 billion gallons of ethanol and about 1.808 billion bushels of corn in 2024. Note that by 2025, China plans to shift to produce cellulosic ethanol by using grasses, forest waste, and crop residues.
Alternatively, if China does not entirely achieve the ethanol plan capacity expansion necessary to meet the upsurge in ethanol demand that the planned 10 percent ethanol blending would bring, U.S. ethanol exports to that country may grow, contingent to China’s reduction of the ethanol import duty now in place.
China to Eliminate Value Added Tax on DDGS Imports
Meanwhile, China recently announced it will eliminate the 11 percent value-added tax (VAT) on imports of distillers dried grains with solubles (DDGS). China has yet to announce when this reduction will take place. Removal of VAT has the potential to boost exports to that country; however, 2016 China’s antidumping and countervailing duties against DDGs coming from the United States remain in place. U.S. DDGS exports to China declined in 2015/16 to 3.342 million metric tons (MT) from the volume in 2014/15 (5.366 million MT). U.S. DDGS exports to China during 2016/17 further deteriorated, declining 77.9 percent to 739,212 MT compared with the previous year.
Note: This report is based on a section of the October 2017 edition of the Agricultural Marketing Resource Center (AgMRC) Renewable Energy Report: “Latest on U.S. Corn Ending Stocks: Second Largest Since 1987/1988” http://bit.ly/Oct2017_AgMRC
Want more news on this topic? Farm Bureau members may subscribe for a free email news service, featuring the farm and rural topics that interest them most!