Bearish Surprises for Corn and Soybeans in Latest WASDE Report
Author
Published
1/15/2024
Introduction
The USDA released its updated WASDE report on January 12, 2024. The January report is one of the more watched WASDE reports of the year as it coincides with the USDA’s final production estimate for 2023 and a quarterly grain stocks update. After this report supply estimates for the marketing year are relatively final and the market’s focus shifts more fully to demand stories.
This report brought overall bearish news to both the corn and soybean markets. Table 1 shows some key report estimates along with trade analyst expectations. Both corn and soybean yields exceeded the highest expectations. WASDE estimates for production and endings stocks domestically and globally also exceeded trade expectations, particularly for world corn stocks. Domestic production estimates were not as far off as yield estimates, as WASDE also made unexpected cuts to total harvested acres.
The December 1st grains stocks report showed estimates slightly above trade expectations (Table 2). The stocks report had some updates to old crop data but the previous year’s ending stocks were not changed much.
Table 1. January 2024 USDA WASDE vs Market Expectations

Table 2. December 1st Grain Stocks vs Trade Expectations

Initial Market Reaction
The immediate market reaction to the USDA reports was negative for both corn and soybeans. Within minutes after the reports, March corn dropped from $4.55/bu to $4.4125/bu before recovering to $4.48/bu by the close of trading. March Soybeans dropped from $12.38/bu (already about a nickel lower on the day prior to the reports) to a low of $12.03/bu before recovering to $12.26/bu by the close of trade. Soybean products also fell on the report with soybean oil closing lower on the day but soybean meal recovering to close slightly higher on the day. Wheat and oats were also lower after the reports.
Changes to Domestic Balance Sheets
This section summarizes changes to the corn and soybean balance sheets in more detail.
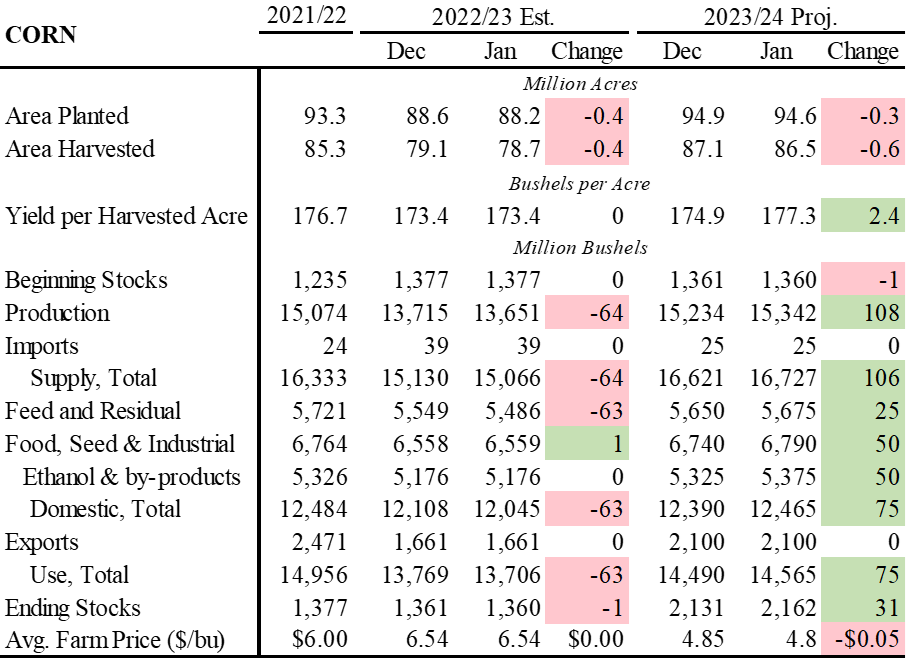
As mentioned above, the stocks report provided USDA with additional insight into this and last year’s stocks. For corn, this caused a change in projected acres harvested last year. Ending stocks were left relatively unchanged so this did not have much impact on the market.
Changes to this year’s corn crop are what the market focused on in this report. The US yield estimate was raised to 177.3 bu/ac. This will be a record if it stands but it is still subject to potential adjustments. Even with cuts to acres harvested this jump in yield raised production. Some offsetting increases in corn use helped keep the increase in ending stocks more moderate, but they were still raised 31 million bushels. This caused annual average farm price forecasts to be lowered $0.05/bu.
Table 3. January 2024 WASDE Corn Balance Sheet
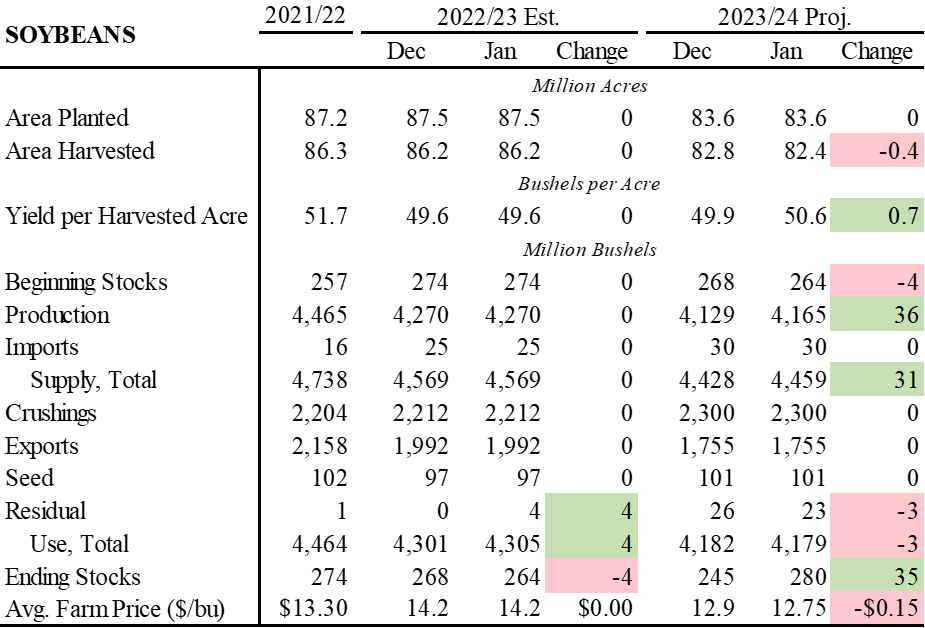
The previous year’s soybean estimates were left almost untouched, save for a slight reduction in ending stocks due to an increase in residual use.
Like corn, cuts to acres harvested were not enough to over a significant increase to soybean yield, leading to higher total production. The new projected soybean yield would not be a record as two previous years have been higher: 2016 (51.9 bu/ac) and 2021 (51.0 bu/ac). However, with no increases in demand, ending stocks were raised 35 million bushels and the projected annual average farm price was lowered $0.15/bu.
Table 4. January 2024 WASDE Soybean Balance Sheet
Yield Changes
Both corn and soybean yields were raised significantly in the latest WASDE report. The USDA crop production report provides more detail on where these new bushels of production came from.
For corn, more states in the eastern corn belt saw small to moderate increases in yield (Figure 1). However, Nebraska saw the biggest gain of 9 bu/ac, a 5.2% increase relative to the Nov estimate. Some states outside the corn belt saw notable drops in yield including Idaho, Texas, Georgia, and New York. However, acres in these states are lower, so changes in yield have less impact on total production.
Iowa’s yield was only raised 1 bu/ac, from 200 to 201.
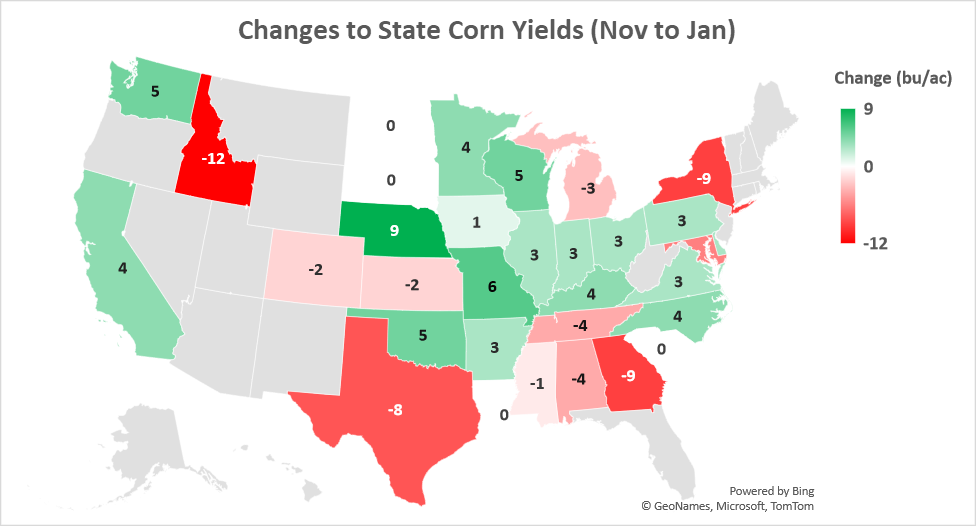
Figure 1. Changes to State Corn Yields (Nov to Jan)
For soybeans, increases to yield were stronger str in Oklahoma. Increases also occurred in a few upper Midwest states and in the Georgia and South Carolina. Most other states saw slight decreases in yield. However, like in corn, states with lots of acres like Missouri and Illinois had yield gains that offset other states with poorer yields.
Iowa’s yield was left unchanged at 58 bu/ac.
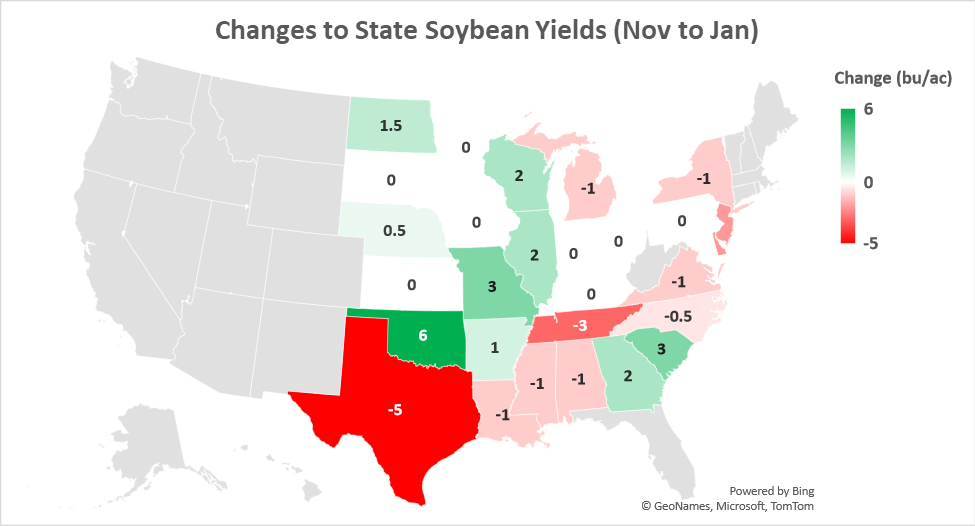
Figure 2. Change to State Soybean Yields (Nov to Jan)
Want more news on this topic? Farm Bureau members may subscribe for a free email news service, featuring the farm and rural topics that interest them most!