2022 Final Crop Production Report
Published
1/13/2023
Report Highlights
The USDA’s final crop production estimates for 2022 were released January 12, 2023. Both corn and soybean production came in below November estimates for the US and for Iowa (Table 1 and Table 2).
Table 1. 2022 US USDA Estimates for Corn and Soybeans

Table 2. 2022 Iowa USDA Estimates for Corn and Soybeans

One of the biggest changes was to harvested corn acres, which were adjusted down 1.6 million acres from the November estimate. Figure 1 shows the change in 2022 harvested corn acres by state relative to November estimates. Generally, west of the Mississippi River, there were reductions in harvested acres and east of the Mississippi River there were increased harvested acres. Plains states that were most affected by drought saw the largest decrease in harvested corn acres. This combined with the fact that US yields increased, suggests the drought caused more failed acres than what was anticipated in November. Failed acres reduce the number of harvest acres and could increase the yield if acres that had poor yield projections were not harvested.
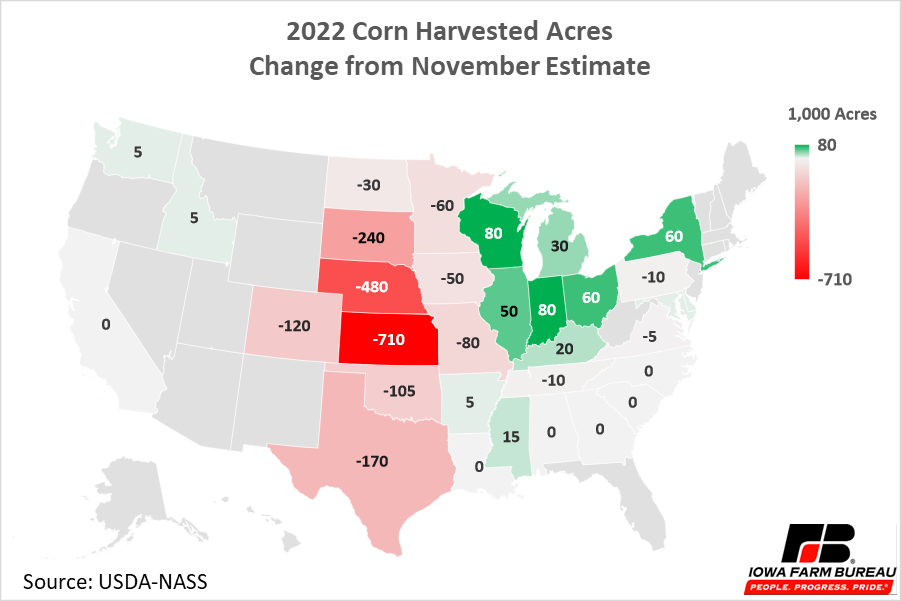
Figure 1. 2022 Corn Harvested Acres – Change from November Estimate
Corn Production Comparison to Previous Years
US corn production in 2022 was down relative to 2021, with 13.7 billion bushels this year compared to 15.1 billion bushels last year (Figure 2).
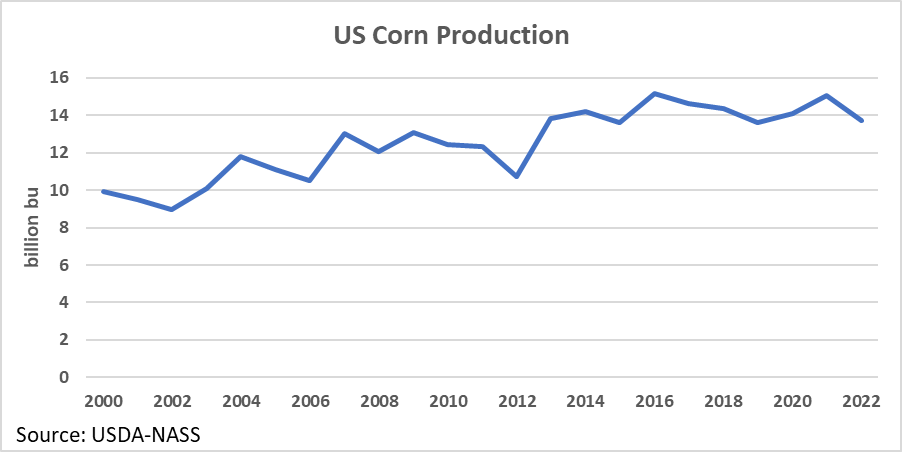
Figure 2. US Corn Production
The reduction in US corn production was not consistent across states. Figure 3 and Figure 4 show maps comparing 2022 corn production to 2021 corn production on a bushel and percentage basis.
Many states, especially those in the great plains, battled drought throughout the year and finished the year with lower production relative to 2021. As mentioned above, the reduction in acres, had a large effect on total production in the plains state. Though other states in the corn belt that saw increased acres, saw reduced production as a result of reduced yields.
On the other hand, a few states saw increased production. Notably Minnesota and Illinois saw stronger yields which lead to higher production despite the total acres harvested falling in both states.
Arizona saw a large increase in production on a percentage basis, though Arizona is not a major corn producing state. Both yields and acres harvested were up significantly compared to 2021, which lead to large percentage increase.
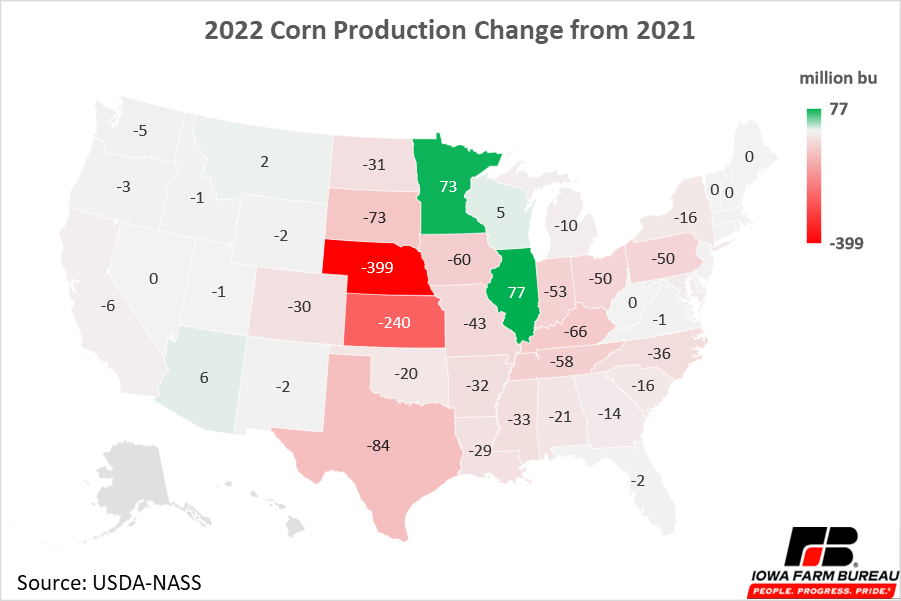
Figure 3. 2022 Corn Production Change from 2021
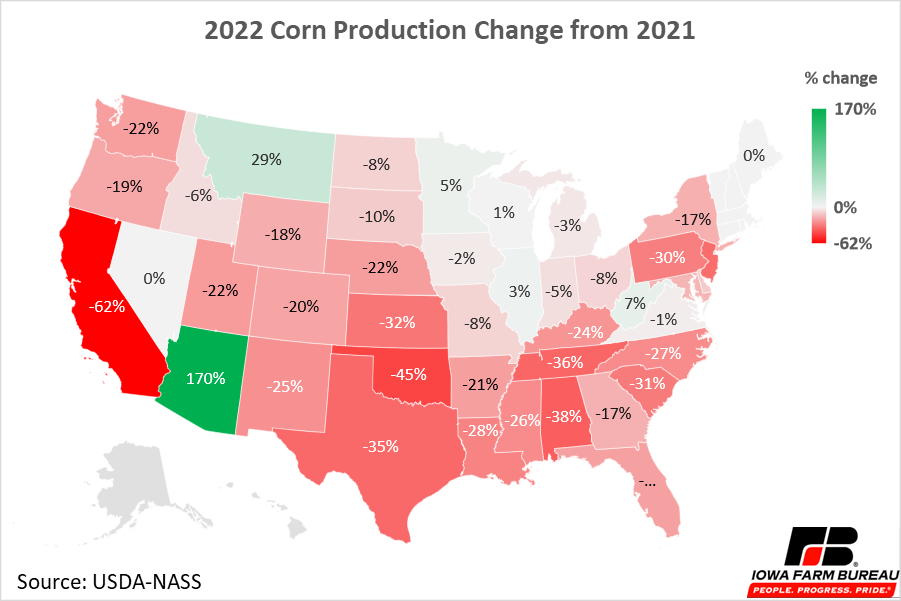
Figure 4. 2022 Corn Production Change from 2021
Soybean Production Comparison to Previous Years
US soybean production was also down compared to last year coming in at 4.28 billion bushels in 2022, below the 4.47 billion bushels produced in 2021 (Figure 5).
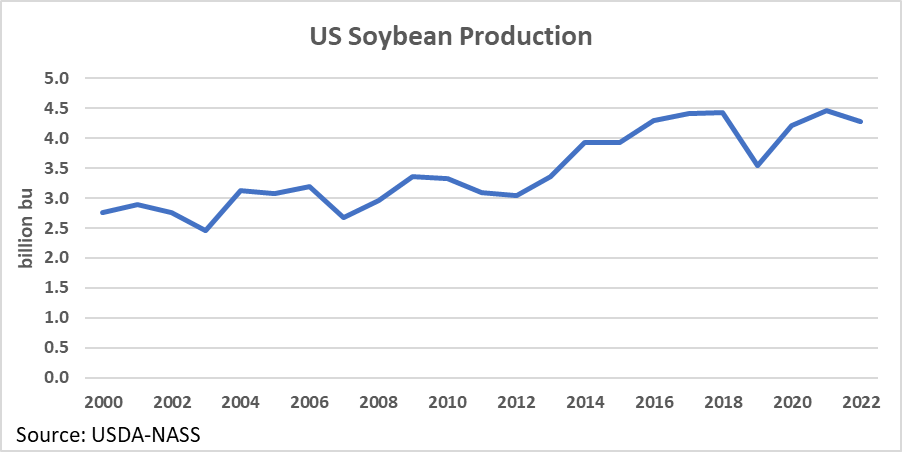
Figure 5. US Soybean Production
Like corn, changes in soybean production were not consistent across states. Figure 6 and Figure 7 show maps comparing 2022 soybean production to 2021 soybean production on a bushel and percentage basis.
The plains states saw the largest reduction in production. This was likely a result of the drought mentioned earlier. Meanwhile, the southeast and far north saw production higher than a year ago.
Some states of interest include Minnesota and Illinois. Both were among the few states to see increased corn production. Minnesota saw increased soybean production despite fewer acres due to higher yields. Interestingly, while Illinois enjoyed higher corn yields, soybean yields declined. Increased soybean acres were not enough to overcome the yield decline in Illinois, leading to lower production.
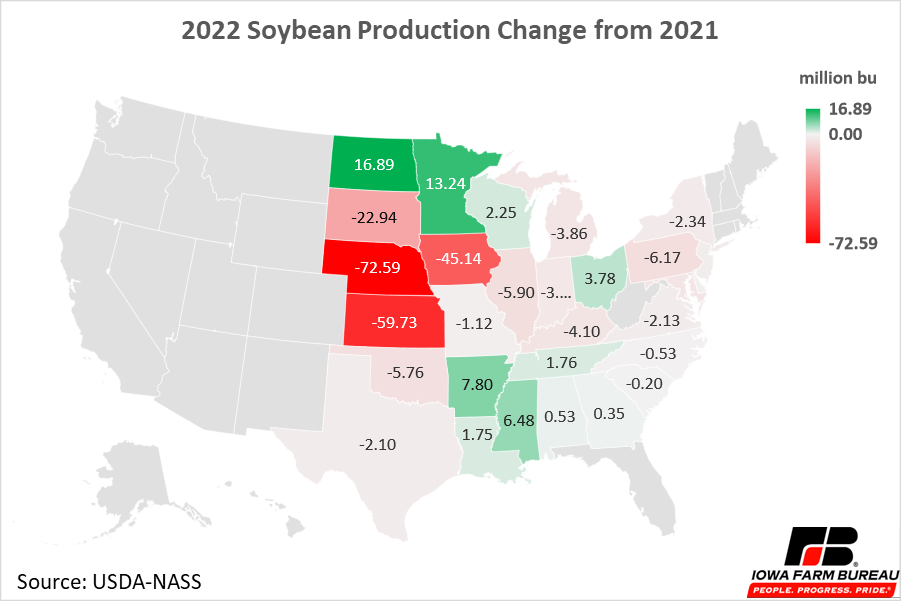
Figure 6. 2022 Soybean Production Change from 2021
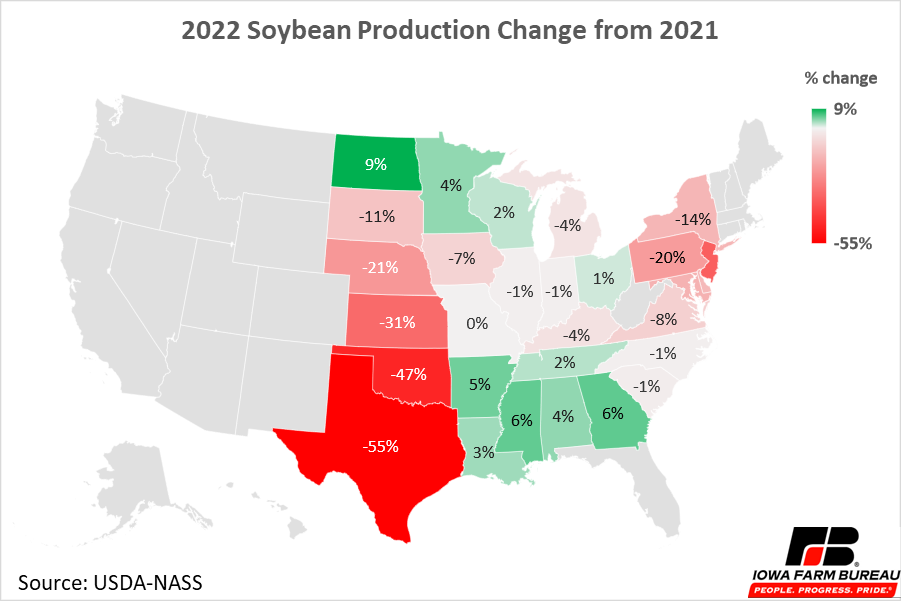
Figure 7. 2022 Soybean Production Change from 2021
Economic analysis provided by Aaron Gerdts, Research Analyst, Decision Innovation Solutions on behalf of Iowa Farm Bureau.
Want more news on this topic? Farm Bureau members may subscribe for a free email news service, featuring the farm and rural topics that interest them most!