2017/18 U.S. Soybean Exports Keeping Up with Projection Despite the Threat of Tariffs
Author
Published
6/8/2018
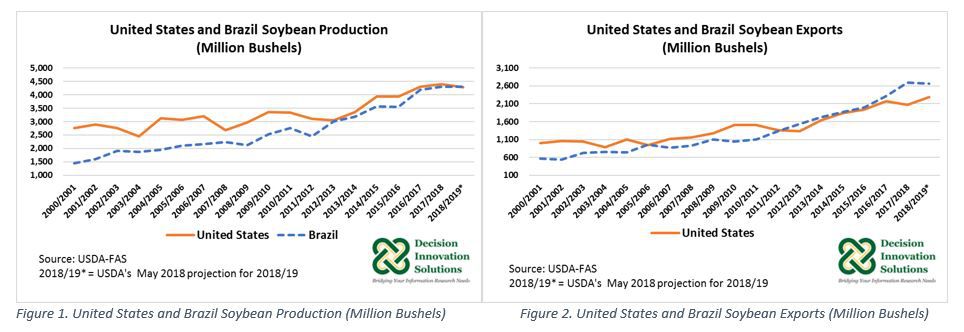
USDA’s May 2018 edition of the World Agricultural Supply and Demand Estimates Report (WASDE) contained the first outlook for the 2018/19 marketing year. Projections for U.S. soybeans indicate lower production but increased supplies, crush, and exports. Based on lower harvested area and trend yields, U.S. soybean production is anticipated down 2.6 percent to 4.280 billion bushels compared with last year’s record high of 4.392 billion bushels, nonetheless, is still projected as the third-largest on record. Soybean supplies are forecast to grow by 117 million bushels (2.5 percent) to 4.835 billion bushels year over year. Higher beginning stocks at 530 million bushels, resulting from larger 2017/18 production and projected lower 2017/18 exports (2.065 million bushels) are supporting the anticipated increased beginning stocks in the 2018/19 marketing year. 2018/19 soybean exports (2.290 billion bushels) are forecast to increase 10.9 percent year over year. Currently the United States is the world’s largest soybean producer and second largest exporter, after Brazil (see Figures 1 and 2), but the USDA May 2018 forecast for 2018/19 indicates U.S. soybean production down 19 million bushels from Brazil’s projected production of 4.299 billion bushels. As of now, Brazil is the top soybean exporter and second largest soybean producer, after the United States, (see Figures 1 and 2). USDA adjusts its initial forecast as the marketing year progresses. A new WASDE report will be published by USDA on June 12, 2018.
China is the world’s largest importer of soybeans. In the 2016/17 marketing year, U.S. soybean exports to China reached a volume of 1.332 billion bushels ($14.573 billion), representing 61.3% of total 2016/17 U.S. soybean exports (2.174 billion bushels). Fifty percent (50.6 percent) of U.S. soybean production was exported in the 2016/17 marketing year to all markets, with China’s shipments representing 31 percent of U.S. soybean production.
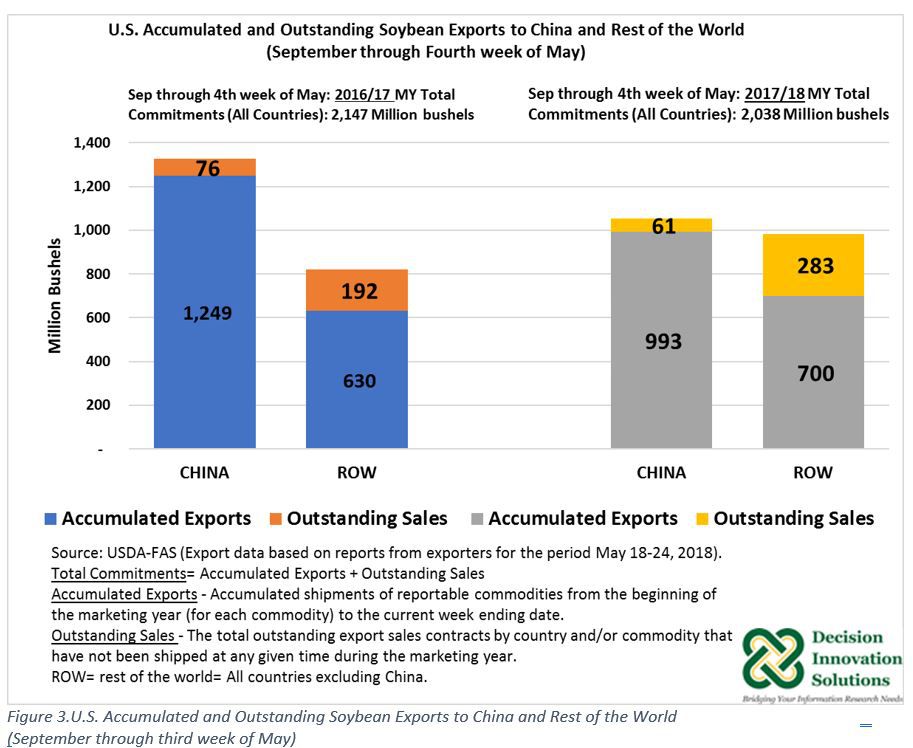
Current USDA-FAS export data comprising the first nine months of the 2017/18 marketing year (from September 9, 2017 to May 24, 2018) indicates accumulated U.S. soybean exports to China during this period were equal to 933 million bushels, down by 256 million bushels year over year (1.249 billion bushels). In addition, as of May 24, 2018, there was an outstanding balance of 61 million bushels destined for China compared with 76 million bushels the previous year (see Figure 3). U.S. soybean export commitments (accumulated exports plus outstanding sales) to China were equal to 1.054 billion bushels compared with 1.325 billion bushels a year ago. Brazil’s large soybean supplies and competitive prices have contributed this marketing year to lower U.S. soybean exports. According to USDA-FAS estimate, 2017/18 Brazil’s production is up 2.5 percent to 4.299 billion bushels year over year and the May 2018 projection for the 2018/19 marketing year indicates the same volume as in 2017/18. China is the main market for Brazil’s soybeans. According to calendar year export data reported by USDA-FAS based on the United Nations Commodity Trade Statistics, Brazil’s share of soybean exports to China has increased from 69 percent in 2012 to 79 percent in 2017. Indicating Brazil’s increasing dominance in the soybean trade world. Brazil and the United States account for about 80 percent of global soybean shipments.
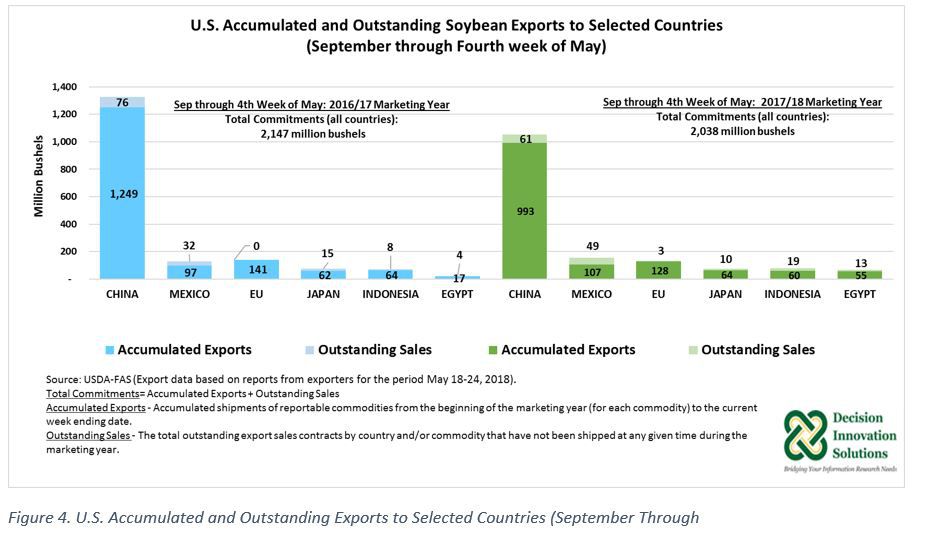
Meanwhile, U.S. soybean total export commitments to the rest of the world (ROW), which represents other markets, excluding China, increased by 162 million bushels to 983 million bushels for the September 9, 2017, through May 24, 2018 period, compared with the same time the previous year (822 million bushels), helping to offset, in part, the reduction of sales to China. The 983 million bushels of U.S. soybean total commitments to ROW consisted of 700 million bushels of accumulated exports and 283 million bushels of outstanding sales (see Figure 3). While U.S. soybean total commitments to China declined from 62 percent to 52 percent during the first nine months of the 2017/18 marketing year relative to the same period the previous marketing year, U.S. soybean total commitments to ROW increased to 48 percent in 2017/18 (September to May) from 38 percent in 2016/17. Within ROW markets the top five destinations for U.S. soybeans during the first nine months of 2017/18 were Mexico, European Union (EU), Japan, Indonesia, and Egypt. As May 24, 2018, U.S. soybean total export commitments to Mexico, EU, and Japan were equal to 155 million bushels, 131 million bushels, and 74 million bushels, respectively, whereas total exports commitments to Indonesia and Egypt reached volumes of 79 and 68 million bushels, correspondingly. U.S. soybean total exports commitments to Mexico, Indonesia, and Egypt have increased so far this marketing year, while total exports to EU and Japan declined (see Figure 4).
U.S. soybean total commitments to all markets by May 24, 2017, were 2.038 billion bushels, including 1.693 billion bushels in accumulated exports and 345 million bushels in outstanding sales (U.S. soybean sales waiting to be shipped) compared with 2,147 billion bushels, the total commitments to the world during the same time last year. At this rate, 27 million bushels of new export sales are needed to reach the 2.065 billion bushels soybean export projection for the 2017/18 marketing year, granted no cancellations of outstanding export sales occurred hereafter; however, cancellations happen due to factors such as contract adjustments, buybacks, loading tolerances, switching sales to the next marketing year, or policy changes. Based on USDA-FAS data, soybean export cancellations were equal to 42.5 million bushels, from May 3 to May 24, 2018, at the same time, new export sales totaled 70.8 million bushels, resulting in a net change of 28.3 million bushels. Cancellations of export sales bound for China represented 17.5 percent (7.4 million bushels) of total cancellations, whereas new sales to China were equal to 8.3 percent (5.9 million bushels) of total new sales during the first four weeks of May. As of May 24, 2018, there were 61 million bushels in outstanding sales bound for China and 283 million bushels waiting for shipments to ROW.
Tariffs Looming on U.S. Soybeans
After the Trump Administration renewed intentions on May 29, 2018 to impose a 25 percent duty on $50 billion Chinese products. China indicated it will retaliate by applying nearly $50 billion tax of U.S imports, including soybeans. However, as reported on June 5, 2018, China offered to purchase about $70 billion of U.S. products including soybeans, corn, natural gas, crude oil, coal, and manufacturing products to avoid U.S. trade tariffs. This offer would be voided if the U.S. continues with its plan to impose tariffs which would take effect shortly after June 15, 2018.
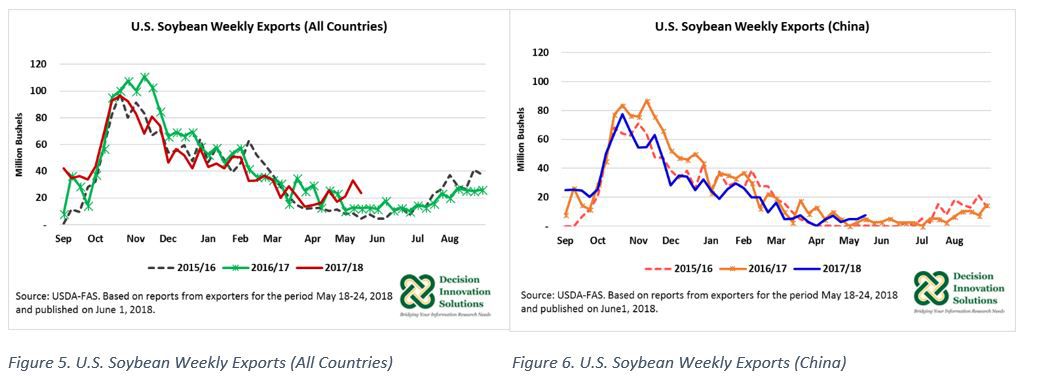
Import tariffs on U.S. soybeans imposed by China would have the most impact in the 2018/19 marketing year (September to August). USDA’s 2018/19 projection for U.S. soybean exports indicates a 10.9 percent increase year over year. This projection is based on normal trade relations with other countries. As of May 24, 2018, U.S. total soybean outstanding sales for the 2018/19 marketing year were equal to 233 million bushels, with almost one fourth of those sales bound for China (54 million bushels). As the largest importer of U.S. soybeans, China’s imports influence U.S. soybean trade. As indicated in Figures 5 and 6, most U.S. soybean exports sales are made during the first half of the marketing year, which is the time when China makes most of its U.S. soybean purchases.
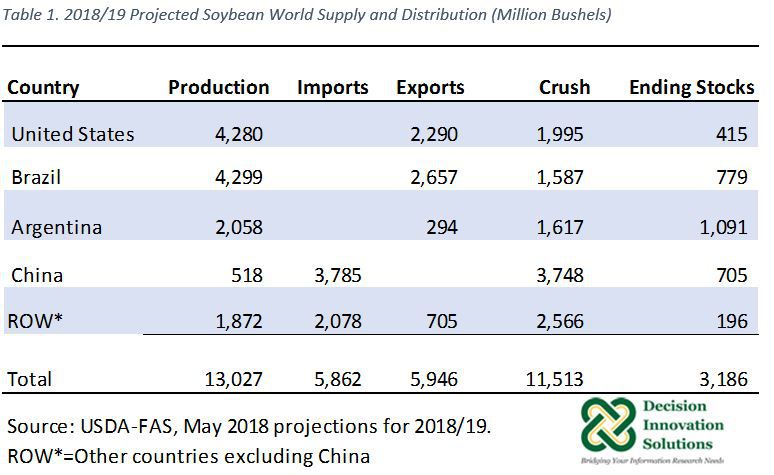
Based on USDA-FAS 2018/19 projected soybean world supply and distribution data, published in May 2018, China is projected to import 3.785 billion bushels of soybeans from all sources in 2018/19 to supply its crush demand (3.748 billion bushels) (see Table 1), while ROW is forecast to import 2.078 billion bushels of soybeans during next marketing year. Given China’s large demand for soybeans to support its livestock and aquaculture industries, even if imposing tariffs on U.S. soybeans, the country would still need to purchase U.S. soybeans, albeit at a higher price depending on the tariff imposed, hurting China’s own importers and consumers. Alternatively, China could look to partially replace soybeans as a feed ingredient with other ingredients while increasing soybean imports from Brazil, as well as Argentina, and ROW during the 2018/19 marketing year. As Table 1 indicates, Brazil, Argentina, and ROW soybean exports are forecast at 2.657 billion bushels, 0.294 billion bushels, and 0.705 billion bushels in 2018/19, respectively, for a total of 3.656 billion bushels.
Soybean Export Outlook for 2018/19
According to the first USDA-FAS forecast for the 2018/19 marketing year, robust global soybean demand led by China supports expected growth in global soybean imports. 2018/19 U.S. soybean production is forecast to decline 2.5 percent year over year. Projections indicate 53.5 percent of this production would be exported, with forecasts showing a 10.9 percent increase in foreign sales compared with the previous year to a record of 2.290 billion bushels; Meanwhile, Brazil’s 2018/19 production is expected to remain flat year over year. While Brazil is expected to continue as the number one soybean exporter, shipping 61.8 percent of its production, exports would decline by 1 percent.
Given China is the leading importer of U.S. soybeans and China’s increasing demand for soybeans to supply its livestock and aquaculture industries, a positive resolution to trade tensions between these countries is crucial. U.S. soybean exports are central not only to U.S. soybean producers but also to the U.S. economy. Last calendar year (2017), U.S. soybeans led U.S. agricultural product exports with $21.6 billion and 15.6 percent of total U.S. agricultural export ($138.5 billion) worth. U.S. soybean exports to China were valued at $12.4 billion. Meanwhile, 2017/18 exports are advancing despite the threat of China’s tariffs since most U.S. soybean sales to China occur during the first six months of the marketing year, and trade tensions between the United States escalated around March of this year.
Want more news on this topic? Farm Bureau members may subscribe for a free email news service, featuring the farm and rural topics that interest them most!