U.S. Turkeys: Recent Production, Exports, and Outlook for 2018 and 2019
Author
Published
8/30/2018
Turkey Production
In 2015, the U.S. poultry industry faced several outbreaks of Highly-Pathogenic Avian Influenza (HPAI) affecting mainly table egg layers and turkeys in the Midwestern states. The virus negatively impacted production, trade, and prices.
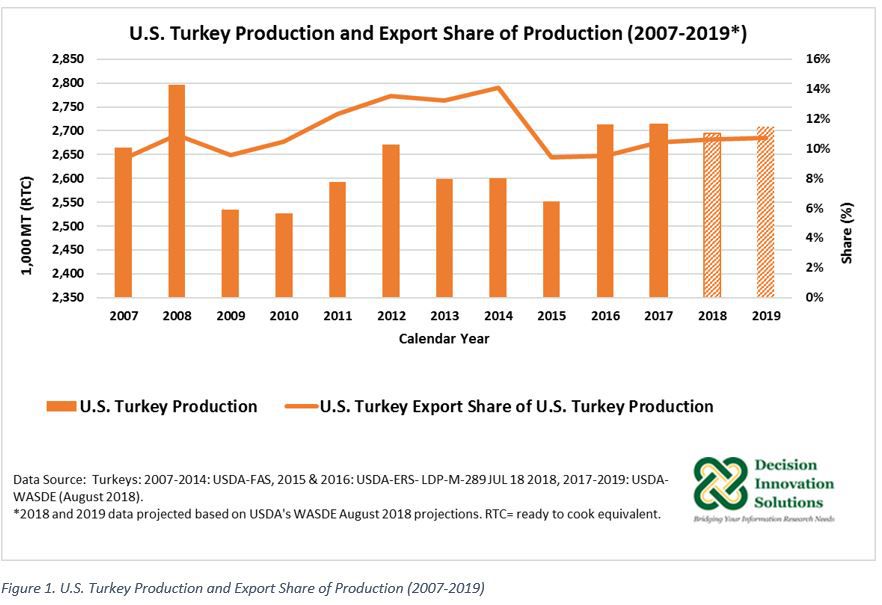
The USDA-World Agricultural Outlook Board (WAOB) publishes U.S. turkey production and trade data in the monthly World Agricultural Supply and Demand Estimates (WASDE) report. 2015 U.S. turkey production declined 1.8% to 2.552 million MT RTC year over year (see Figure 1). Although 2016 U.S. turkey production recovered from the 2015 level, showing a 6.3 percent increase to 2.713 million MT RTC, 2017 production stayed stagnant (see Figure 1).
According to USDA-NASS 2017 slaughter data (measured in metric tons live weight (LWE) equivalent) of young turkey, which represented 99.2 percent of total turkey slaughtered in 2017, the top five U.S. turkey producers in 2017 were Minnesota (507,476 MT LWE, 15.1 percent share), Indiana (411,699 MT LWE, 12.2 percent share), North Carolina (362,071 MT LWE ,10.8 percent share), Virginia (332,592 MT LWE , 9.9 percent share), and Arkansas (324,905 MT LWE, 9.7 percent share). These five states comprised 57.6 percent (1.939 million MT LWE) of 2017 total U.S. turkey production (3.366 million MT LWE).
Iowa Turkey Production Increased in 2017
Despite 2017 U.S. turkey production remaining unchanged from the previous year, based on 2017 slaughter data of young turkeys, 2017 Iowa turkey production (272,192 MT LWE) was up 30 percent from 2015 (209,368 MT LWE). In addition, 2017 Iowa’s turkey production increased 6.0 percent from 2016 (256,873 MT LWE). In 2017, Iowa was the sixth largest turkey producer in the United States, accounting for 8.1 percent of total U.S. 2017 turkey production. Iowa’s average weight of turkeys slaughtered in 2017 was 41 pounds/head, which was up 16 pounds/head from Minnesota’s average (26 pounds/head) and above 10 pounds/head from the national average (31 pounds/head).
2018 U.S. Turkey Production Projected Lower Year-Over-Year
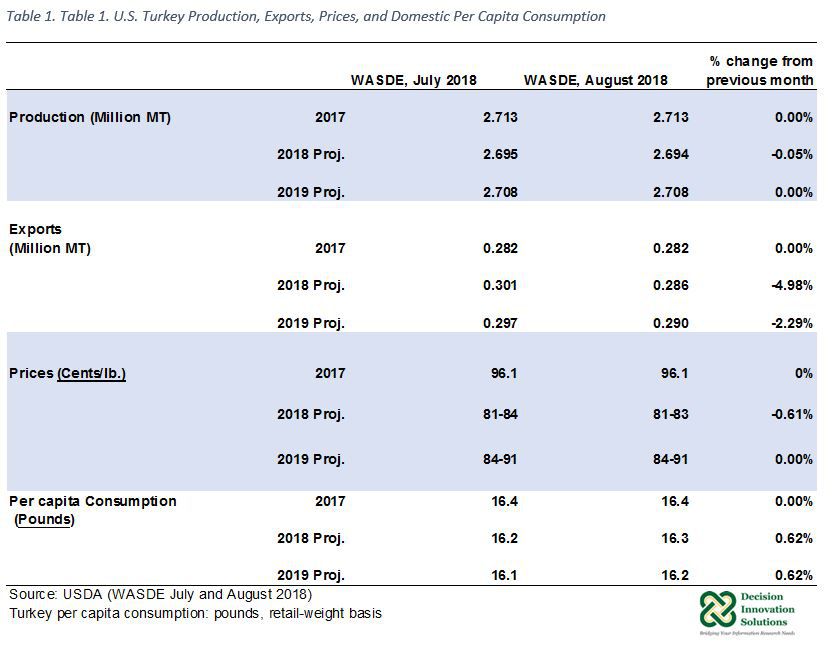
Based on hatchery data, USDA’s WASDE August 2018 projection for current calendar year production indicates a 0.7 percent reduction to 2.694 million MT RTC compared with 2017. This projection was slightly down from the July projection (2.695 million MT RTC). August 2018 USDA’s projection for U.S. turkey production in 2019 reflects a slow recovery, indicating a 0.5 percent increase to 2.708 million MT RTC. As reported by USDA, historically low prices and rising stocks in cold storage are influencing U.S. turkey production forecasts for 2018 and 2019.
USDA-NASS’s poultry slaughter data published on July 25, 2018, indicates U.S. young turkey slaughtered during the first half of 2018 was down 1.2 percent to 1.650 million MT LWE from the same period the previous year. Young turkey slaughtered was up for Minnesota (1.6 percent to 252,163 MT LWE), Indiana (3.5 percent to 210,387 MT LWE), North Carolina (0.3 percent to 183,587 MT LWE), and Virginia (1.6 percent to 168,117 MT LWE). In contrast, slaughter was down for Arkansas (4.7 percent to 151,288 MT LWE), Iowa (1.0 percent to 137,585 MT LWE), and “Other States” (4.5 percent to 546,940 MT LWE). The Other States category includes California, Missouri, Ohio, Pennsylvania, and Texas.
From January to June 2018, the weight of young turkey slaughtered in Iowa averaged 42 pounds/head. This was highest in the top six producers, whereas for Arkansas young turkey slaughtered average 19 pounds/head. This was the lowest among top producers. The national average weight of young turkey slaughtered was 31 pounds/head during the first six months of 2018.
The latest USDA projection for 2018 turkey prices reflects a 14.7 percent reduction to an average price of $0.820/pound ($0.81/pound to $0.83/pound) from the 2017 estimate ($0.961/pound). Compared with 2018, U.S. turkey prices for 2019 are expected up 6.7 percent to $0.875/pound ($0.84/pound to $ 0.91/pound). August 2018 turkey price projections declined 5 cents /pound from July’s projection, whereas 2019 projection remained unchanged month-after-month projections.
U.S. Turkey Exports
The USDA-Foreign Agricultural Service (FAS) no longer publishes U.S. and world production and trade data for turkey meat. Historical data available through 2014 from USDA-FAS indicates that in 2014 the United States exported 56.6% of world turkey exports (0.647 million MT RTC). The United States produced 2.6 million MT RTC of turkey meat in 2014. U.S. turkey export share was 14.1% (0.366 million MT RTC) of 2014 U.S. turkey production (see Figure 1).
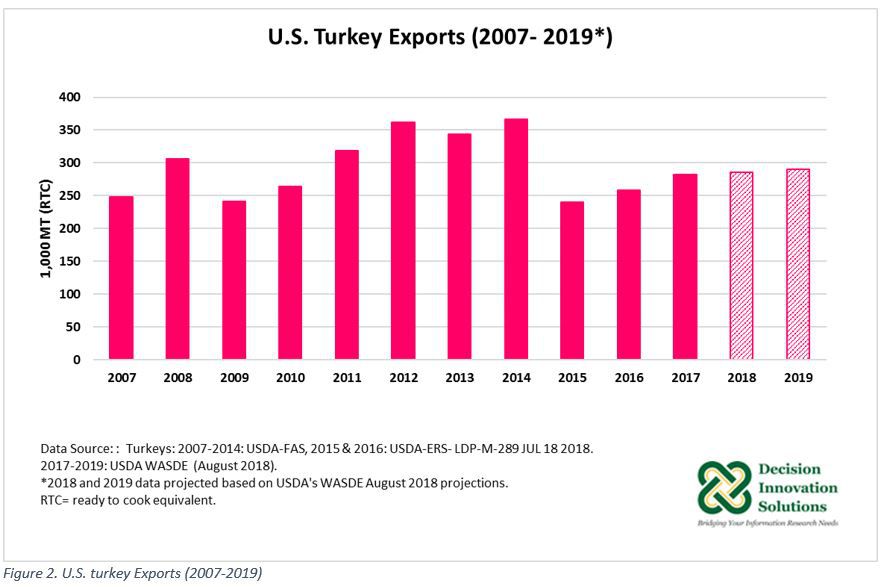
Based on USDA-FAS data, 2015 U.S. turkey exports dropped 34.4% to 0.240 million MT RTC compared with the previous year. In 2015, U.S. turkey production and exports were negatively impacted by HPAI, causing both production and exports to fall.
U.S. turkey exports bounced back in 2016 and 2017, exporting 0.258 and 0.282 million MT RTC equivalent, respectively. According to USDA’s August 2018 forecasts, U.S. turkey exports would grow 1.3 percent to 0.286 million MT RTC year over year, whereas turkey exports are forecast up 1.6 percent to 0.290 million MT RTC in 2019 compared with 2018 (Figure 2). As in the case of broilers, both 2018 and 2019 export projections were reduced from the previous month due to lower-than-expected foreign demand.
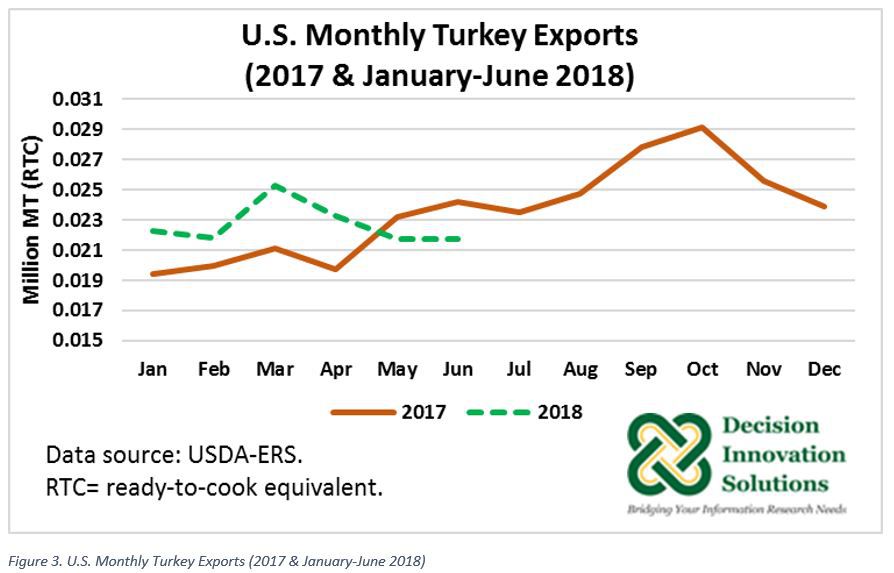
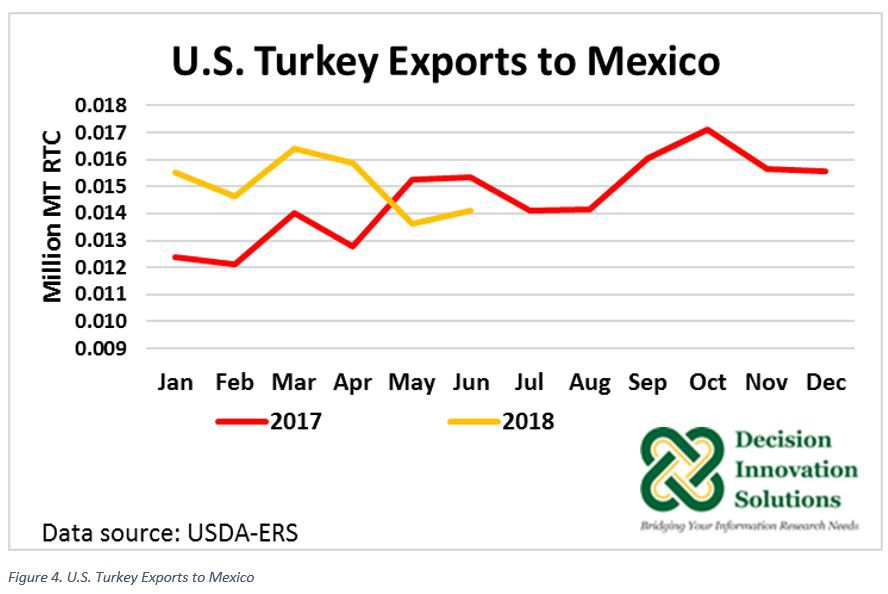
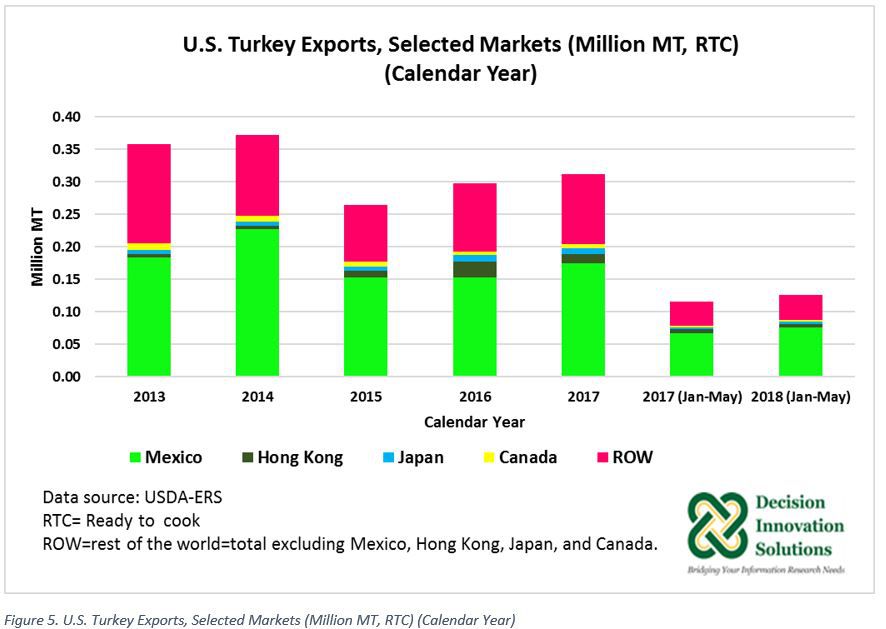
U.S. turkey monthly export data through June 2018 indicated U.S. turkey exports reached a volume of 21,761 MT RTC in June 2018. Exports were down 10.0 percent year over year and slightly up (0.3 percent) from the previous month (see Figure 3). Mexico is the number one market for U.S. turkey meat. From 2013 to 2017, on average, 61 percent of U.S. turkey exports were shipped to that market. Data for the first half of 2018 shows 66 percent of U.S. turkey exports went to Mexico compared with 64 percent in 2017 (January to June). According to USDA-ERS monthly data, exports to Mexico declined 14.12 percent to 13,628 MT RTC in May from the previous month and 10.6 percent year over year. This was the first time since August 2017 that U.S. monthly turkey exports to Mexico fell below the corresponding level during the previous year (see Figure 4). U.S. turkey exports to Mexico improved in June 2018, with exports increasing 3.6 percent to 14,125 MT RTC from the previous month but trailing behind 7.9 percent from a year earlier (see Figure 4). From January to June 2018, U.S. turkey exports to Mexico were up 1% to 90,176 MT RTC year over year. U.S. Turkey exports to other markets include Hong Kong, Japan, and Canada (see Figure 5).
U.S. turkey domestic per capita consumption is forecast to slightly decline in 2018 and 2019 to 16.3 pounds and 16.2 pounds, respectively, compared with 2017 (16.4 pounds).
Based on USDA’s WASDE reports published in July and August 2018, Table 1 summarizes U.S. turkey production, exports, prices, and per capita domestic consumption for 2017 estimates and projections for 2018 and 2019.
Want more news on this topic? Farm Bureau members may subscribe for a free email news service, featuring the farm and rural topics that interest them most!