U.S. Farm Cash Receipts Projected to Edge Lower in 2026 as Iowa Posts 2025 Gains
Author
Published
9/14/2026
The USDA’s September 2026 release estimates that U.S. cash receipts from all agricultural commodities rose 5.2% in 2025 to $542.0 billion from the previous year (see Figure 1). For 2026, total cash receipts are projected to slip 0.3% to $540.3 billion. Both the 2025 estimate and the 2026 projection are notably higher than the values USDA published in February 2026.
U.S. crop cash receipts are projected to increase to $253.0 billion in 2026, up $14.6 billion, or 6.1%, from the latest 2025 estimate of $238.4 billion. The increase reflects projected higher prices for corn, soybeans, and vegetables/melons. Corn cash receipts are expected to rise 11.3% year over year to $67.3 billion, while soybean receipts are projected to grow 10.0% to $47.9 billion.
By contrast, animal and animal product cash receipts are projected to fall 5.4% to $287.3 billion, down $16.4 billion from the 2025 estimate of $303.6 billion. Most of the decline is expected to come from lower sale values for chicken eggs, milk, and hogs. Chicken egg receipts are projected to drop 66.3%, or $10.6 billion, from last year’s record high, reducing their share of total cash receipts from 6.0% in 2025 to 2.0% in 2026. Overall, animal receipts would account for 53.2% of total U.S. cash receipts, with crop receipts making up the remainder.
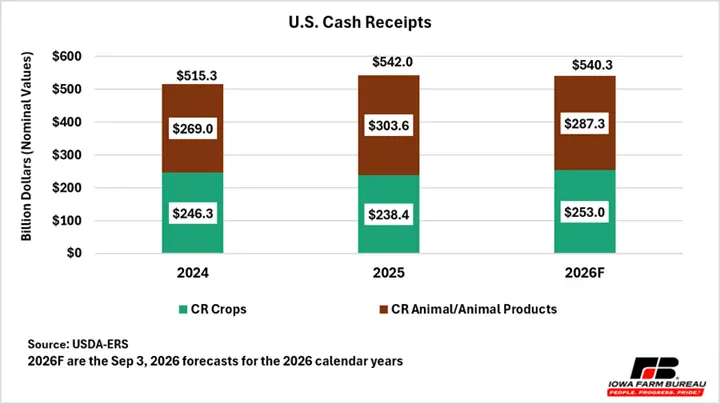
Figure 1. U.S. Cash Receipts
USDA projects net farm income, a general measure of farm-sector profits, to fall 2.6%, or $4.3 billion, to $158.4 billion in 2026 compared with 2025, not adjusted for inflation. Net cash farm income is forecast at $176.4 billion, up $0.7 billion, or 0.4%, from 2025.
According to USDA, in real terms, in inflation-adjusted 2026 dollars, net farm income is forecast to fall by $9.1 billion, or 5.5%, from 2025 to 2026, and net cash farm income is forecast to decline by $4.6 billion (2.5%) compared to 2025. These forecasts indicate both measures in 2026 would surpass their 2006–25 averages (in inflation-adjusted dollars).
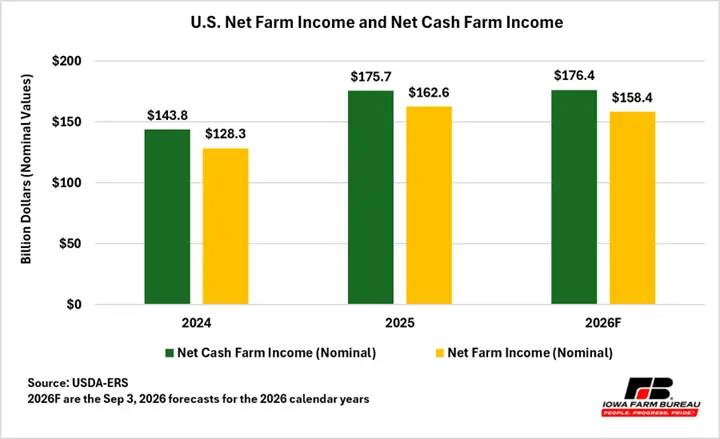
Figure 2. U.S. Net Farm Income and Net Cash Farm Income
Direct government payments are forecast to increase by $19.5 billion to $47.4 billion in 2026 relative to 2025. Agricultural Risk Coverage (ARC) payments are expected to rise 97.4% to $3.7 billion in the current year.
Production expenses, including operator dwellings, are projected to increase by $21.2 billion, or 4.5%, from $471.6 billion in 2025 to $492.8 billion in 2026. The largest spending increases are expected for livestock purchases, fertilizer, lime and soil conditioners, and petroleum fuel/oils.
Iowa Cash Receipts, Expenses, and Government Payments in 2025
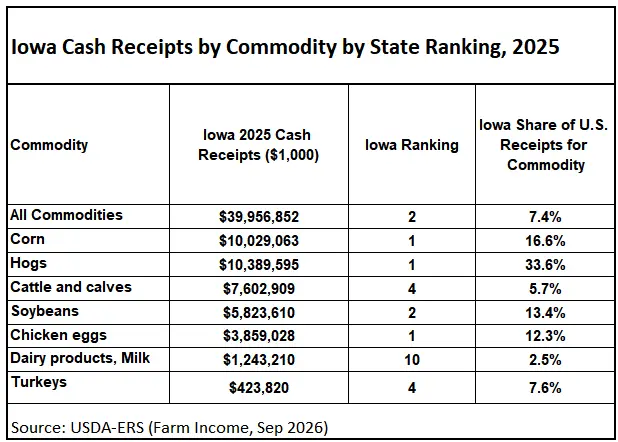
With the September farm income publication, USDA released state-level cash income data for 2025. Iowa’s agricultural cash receipts increased $1.7 billion, or 4.4%, year over year to nearly $40.0 billion. Hog sales generated the state’s largest agricultural cash receipts, rising 15.8%, or $1.4 billion, to $10.4 billion compared with 2024. Hog receipts accounted for 26.0% of Iowa agricultural receipts and 33.6% of U.S. hog sales.
Iowa cattle and calves cash receipts reached $7.6 billion in 2025, up 23.5% from 2024. These receipts represented 19.0% of Iowa agricultural cash receipts and 5.7% of U.S. cattle and calves sales. Overall, receipts from animals and animal products generated 59.3% of Iowa agricultural cash receipts.
Iowa corn sales generated $10.0 billion in 2025, down 14.5% year over year, while still accounting for one-quarter of the state’s agricultural cash receipts and 16.6% of U.S. corn cash receipts. Iowa soybean cash receipts declined nearly $962 million, or 14.2%, to $5.8 billion compared with about $6.8 billion in 2024. Soybeans made up 14.6% of Iowa cash receipts and 13.4% of U.S. soybean cash receipts.
DIS estimates for 2026 were based on Iowa’s last 3 years share of U.S. receipts for corresponding commodities and the U.S. projected cash receipts for 2026. Compared with 2025, corn, soybean, and cattle and calves sales would increase 17.3%, 14.6%, and 3.0% respectively, while hog receipts would decline 2.2%.
Figure 3 shows the trend of Iowa cash receipts from 2016 to 2026. Figure 4 displays the state cash receipts of selected commodities in 2025. Table 1 presents Iowa cash receipts of selected commodities and their corresponding ranking in the country.
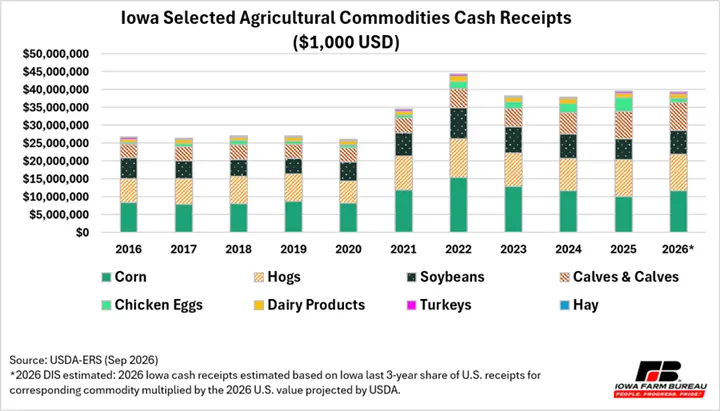
Figure 3. Iowa Selected Agriculture Commodities Cash Receipts
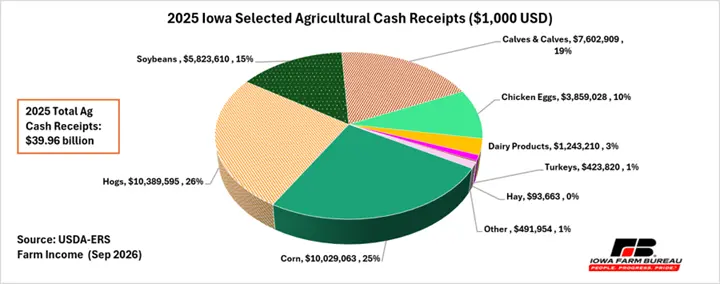
Figure 4. 2025 Iowa Selected Agriculture Cash Receipts
Based on agricultural cash receipts, Iowa was the second largest agricultural state, generating 7.4% of U.S. receipts from all commodities while California contributed with 11.9%.
Table 1. Iowa Cash Receipts by Commodity by State Ranking in the Country, 2025
Production expenses, including operator dwellings, increased to about $36.0 billion in 2025. The largest spending increases were for livestock purchases, petroleum fuel/oils, and fertilizer, lime and soil conditioners.
Government payments increased to $2.1 billion in 2025, up $1.5 billion from 2024. Seventy percent of payments, or $1.5 billion, were from ad hoc emergency programs. Agricultural Risk Coverage payments rose to $164.0 million, accounting for 8.0% of government payments. Overall Iowa’s government direct payments accounted for 7.7% of U.S. government direct payments.
Want more news on this topic? Farm Bureau members may subscribe for a free email news service, featuring the farm and rural topics that interest them most!