September 2026 WASDE Report Recap
Author
Published
9/14/2026
Introduction
The USDA released its updated WASDE report on September 11th, 2026. The September WASDE report includes revised planted and harvested acreage based on updated data from the FSA and RMA.
(New) 2026/27 Marketing Year
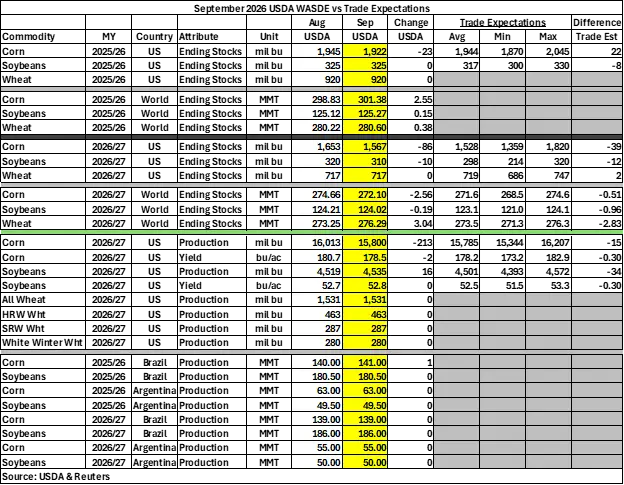
U.S. corn ending stocks decreased by 86 million bushels (mb) to 1,567 mb, exceeding industry expectations by 39 mb. Soybean ending stocks dropped 10 mb to 310 mb, outperforming expectations by 12 mb. Wheat ending stocks remained at 717 mb and generally aligned with average expectations. U.S. corn production decreased 213 mb to 15,800 mb and yield dropped 2.2 bushels per acre (bu/ac) to 178.5 bu/ac. Soybean production increased by 16 mb to 4,535 mb.
World corn ending stocks lost 2.56 million metric tons (MMT), falling to 272.10 MMT and world soybean ending stocks dipped 0.19 MMT to 124.02 MMT, with both slightly outperforming expectations. World wheat stocks gained 3.04 MMT to 276.29 MMT, exceeding expectations by nearly 3.00 MMT.
2025/26 Marketing Year
U.S. corn ending dropped 23 mb to 1,922 mb, falling 22 mb under expectations. Soybean and wheat ending stocks remained unchanged from August, despite trade expectations predicting soybean ending stocks to decrease.
World corn ending stocks increased by 2.55 MMT to 301.38 MMT, world soybean ending stocks rose marginally by 0.15 MMT to 125.77 MMT, and world wheat stocks gained 0.38 MMT to 280.60 MMT.
South American Markets
Brazil’s corn production estimate for the 2025/26 marketing year gained 1.00 MMT, rising to 141.00 MMT. All other estimates remain unchanged from the August WASDE.
Table 1 shows key report estimates for both U.S. and world production.
Table 1. September 2026 USDA vs. Market Expectations
Initial Market Reaction
Corn futures were on the rise prior to the WASDE releasing but dropped immediately after. September corn futures rose to $5.12 initially before dropping 3 cents. December corn futures gained 18 cents to $5.43 prior to the report’s release, but fell 13 cents within the hour. March corn futures followed the same trend, rising to $5.58 before dipping to $5.45.
Soybean futures rose 8 cents leading up to the WASDE’s release before dropping 10-11 cents within a half hour. November soybean futures rose to $13.14 before the report and dipped to $13.03 within 30 minutes. January soybean futures dipped to $13.19 initially and March soybean futures initially fell to $13.25.
September soybean meal initially dropped by $0.3/ton to $346.6/ton before rising throughout the afternoon. October and December soybean meal futures gained $2.5/ton prior to the WASDE, but then fell by $2.2/ton to $347.5/ton for October and $353.6/ton for December within 30 minutes.
Soybean oil futures were trending downward this morning, but received a brief bump of 0.50 cents per pound before fluctuating and falling throughout the afternoon. October soybean oil futures initially rose to 69.86 cents per pound before dipping to 69.68 cents per pound 30 minutes later. December soybean oil futures rose to 70.34 cents per pound before falling to 70.15 cents per pound after half an hour. January soybean oil futures initially increased to 70.63 cents per pound, but dropped to70.37 cents per pound shortly thereafter.
Wheat futures gained 9 cents in anticipation of the WASDE but then lost 8-9 cents within 30 minutes. December wheat futures rose to $7.30 before falling back to $7.21 within half an hour. March wheat futures increased to $7.46 but quickly fell to $7.34.
Changes to Domestic Balance Sheet
This section summarizes changes to the corn and soybean balance sheets in more detail.
Table 2 displays the September WASDE corn balance sheet. For the 2025/26 marketing year, imports increased by 2 mb to 30 mb, resulting in total supply increasing to 18,602 mb. Exports rose 25 mb to 3,425 mb, leading to total use also increasing by 25 mb to 16,680 mb. Ending stocks fell 23 mb to 1,922 mb and average farm price stayed at $4.15 per bushel.
For the 2026/27 marketing year, area planted increased 0.1 million acres to 96.8 million acres but area harvested decreased 0.1 million acres to 88.5 million acres. Expected yield per harvested acre fell 2.2 bu/ac to 178.5 bu/ac. Beginning stocks decreased 23 mb to 1,922 mb and production fell 213 mb to 15,800 mb, resulting in total supply losing 236 mb to 17,747 mb. Feed and residual fell 150 mb to 5,950 mb, which corresponds with total domestic and total use both falling 150 mb to 12,905 mb and 16,180 mb respectively. Ending stocks lose 86 mb to 1,567 mb and average farm price per bushel increased by 30 cents to $4.80 per bushel.
Table 2. September 2026 WASDE Corn Balance Sheet
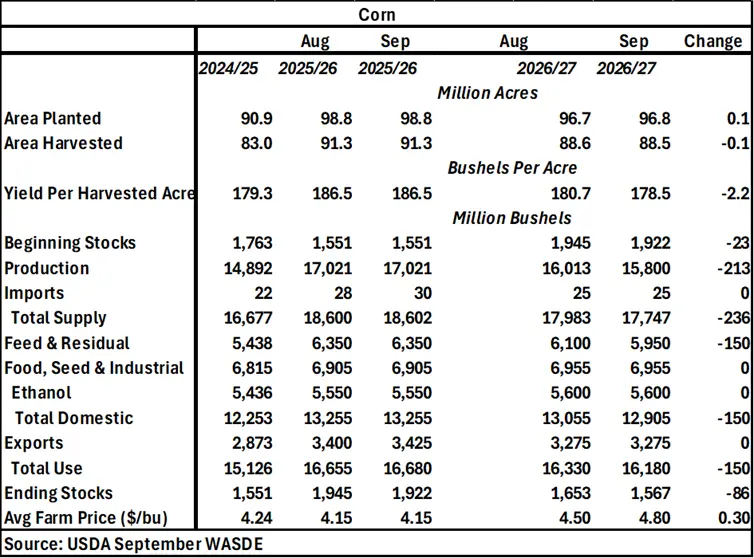
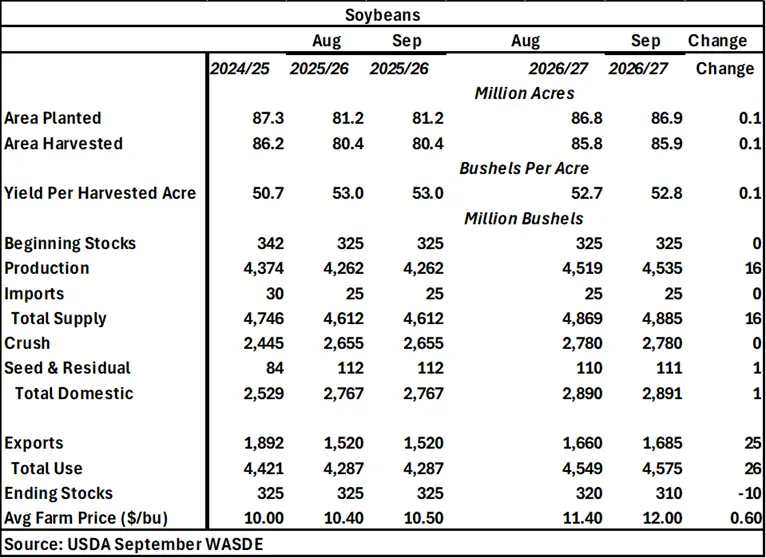
Table 3 displays the September WASDE soybean balance sheet. For the 2025/26 marketing year, average farm price per bushel increased 10 cents to $10.50 per bushel.
For the 2026/27 marketing year, area planted and area harvested both gained 0.1 million acres to 86.9 million acres and 85.9 million acres respectively. Expected yield increased by 0.1 bu/ac to 52.8 bu/ac. Production rose by 16 mb to 4,535 mb, resulting in total supply increasing to 4,885 mb. Feed and residual gained 1 mb to 111 mb, causing total domestic to also increase by 1 mb to 2,891 mb. Exports increased by 25 mb to 1,685 mb, which combined with the change to total domestic, results in total use increasing by 26 mb to 4,575 mb. Ending stocks fell by 10 mb to 310 mb and average farm price rose by 60 cents per bushel to $12.00 per bushel.
Table 3. September 2026 WASDE Soybean Balance Sheet
Want more news on this topic? Farm Bureau members may subscribe for a free email news service, featuring the farm and rural topics that interest them most!