The United States and Canada Agricultural Trade (03/15/2017)
Author
Published
3/16/2017
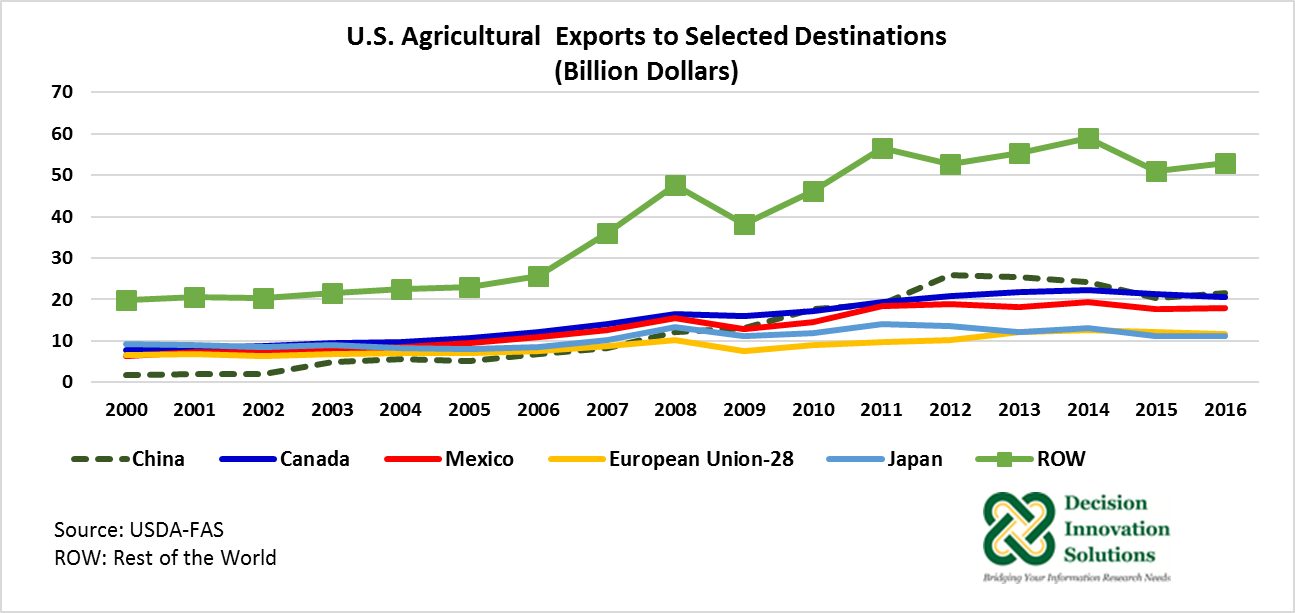
In 2016, Canada was the second largest market for U.S. agricultural products with a value of $20.5 billion. The leading market destination in 2016 was China, with $21.4 billion worth of U.S. agricultural exports (see Figure 1). The export composition of these two markets is different, with U.S. exports to China consisting mainly of bulk commodities, particularly U.S. soybeans. U.S. exports to Canada are comprise of mainly high-value agricultural products (such as consumer-oriented agricultural products). Although the value of 2016 U.S. agricultural exports to Canada declined 3.7% from the previous year, it still represented 15.1% of 2016 total U.S. agricultural exports ($135.5 billion). Overall U.S. agricultural exports in 2016 were up 1.3% year over year, with 2016 U.S. exports to China increasing 5.7% from the previous year ($20.3 billion). The 2016 value of U.S. agricultural exports to Mexico was up 0.8% to $17.9 billion from 2015 ($17.8 billion). In addition, U.S. agricultural exports to the rest of the world (ROW) in 2016 increased 3.9% to $53.0 billion from the 2015 value of $51.0 billion (see Figure 1). ROW’s share of U.S. agricultural exports was 39.1% in 2016.
U.S. Agricultural Trade Balance with Canada
Overall, agricultural trade (exports and imports) between the United States and Canada has increased since the implementation of the North America Free Trade Agreement (NAFTA) in 1994. As Figure 2 shows, from 1996 to 2008, U.S. agricultural exports to Canada were about 88%, on average, of U.S. agricultural imports from Canada, generating a trade deficit between these two countries of $1.25 billion per year during that period. From 2009 to 2012, exports surpassed imports resulting in an agricultural trade surplus between the Unites States and Canada of $0.74 billion, on average, per year. For the last four years (2013 to 2016), there has been an agricultural trade deficit between these two countries that averaged $0.7 billion per year.
Consumer-oriented agricultural products are the main agricultural commodities traded between these two countries (see Figure 3). From 2012 to 2016, on average, 79.8% ($17.0 billion) of the total value of U.S. agricultural products exported to Canada ($21.3 billion, on average), were generated by exports of U.S. consumer-oriented agricultural products. During the same time, the shares of U.S. intermediate and U.S. bulk agricultural products exported to Canada of total U.S. agricultural product exports to that country were 16.3% ($3.5 billion) and 3.9% ($0.8 billion), on average, respectively. On the other hand, consumer-oriented agricultural products imported from Canada during the last five years represented 57.2% ($12.5 billion), on average, of total agricultural imports from that country ($21.8 billion, on average). U.S. imports of intermediate agricultural products and bulk agricultural products from Canada made up 31.5% ($6.9 billion) and $11.3% ($2.5 billion), on average, respectively, from 2012 to 2016.
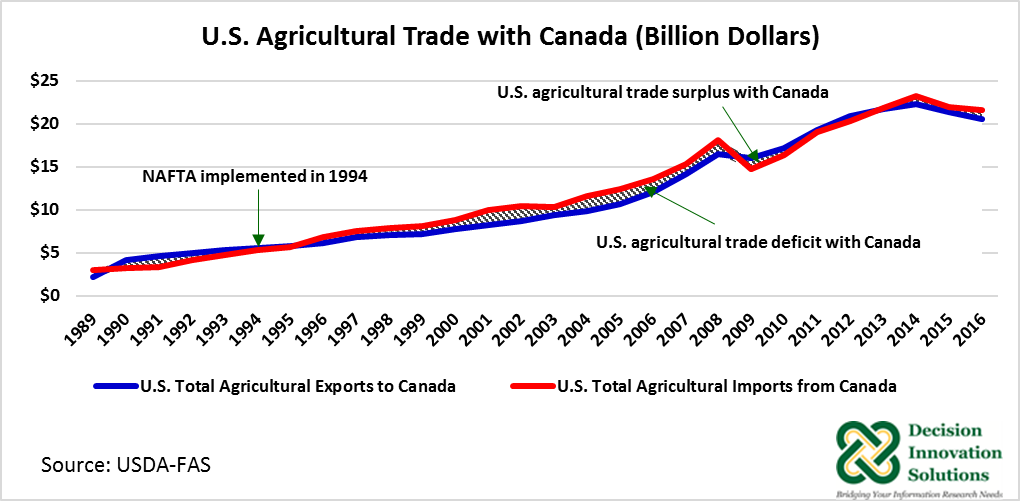
Figure 2.U.S. Agricultural Trade with Canada (Billion Dollars)
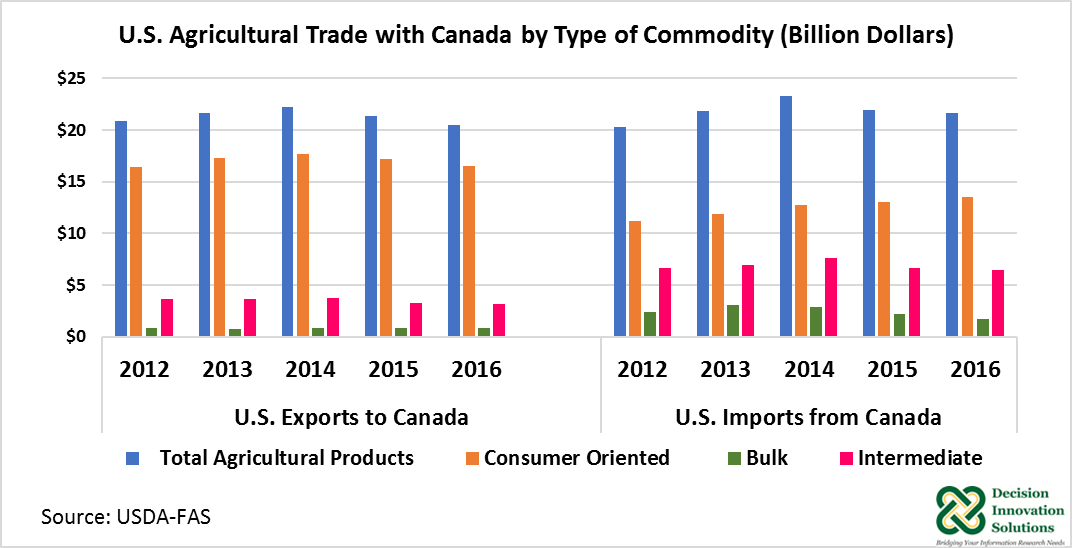
Figure 3. U.S./ Agricultural Trade with Canada by Type of Commodity (Billion Dollars)
Canada: Main Destination for U.S. Consumer-Oriented Agricultural Products
Despite periods of trade deficits between the United States and Canada, Canada has consistently been the number one market for U.S. consumer-oriented agricultural products (high-value agricultural products) (see Figure 4). The 2016 U.S. exports of consumer-oriented agricultural products to Canada were valued to $16.5 billion representing 26.7% (by value) of U.S. total consumer-oriented agricultural product exports in 2016. The second value market for U.S. consumer-oriented agricultural products was Mexico with $8.1 billion (13.1%) in 2016. In 2016, the European Union (EU) and Japan were in third place with U.S. exports of consumer-oriented agricultural products valued at $5.8 billion each. In 2016, the total value of U.S. consumer-oriented agricultural exports to all destinations dropped 1.4% to $61.9 billion year over year. Despite this decline, they represented 45.6% of total U.S. agricultural exports last year.
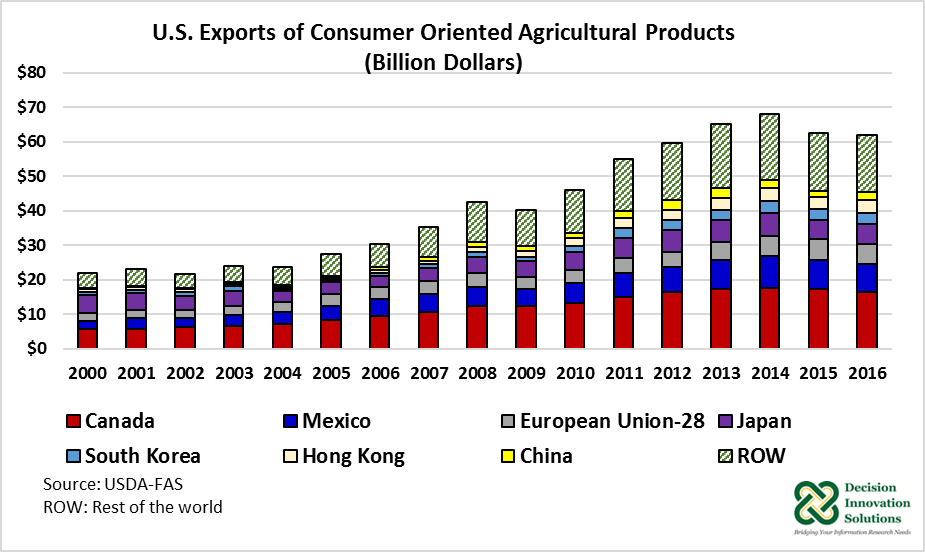
Figure 4. U.S. Exports of Consumer-Oriented Agricultural Products (Billion Dollars)
U.S. Agricultural Trade with Canada by Type of Commodity
U.S. agricultural trade with Canada differs by type of commodity. For instance, from 2006 to 2013 there was a growing positive trade balance (trade surplus) for consumer-oriented agricultural products. The surplus grew from $0.5 billion in 2006 to $5.5 billion in 2013. Since 2013, this trade balance has been declining but there is currently still a positive trade balance (see Figure 5). The U.S. surplus for consumer-oriented agricultural products reached a value of $3.0 billion in 2016.
Both U.S. intermediate and U.S. bulk agricultural commodities have a negative trade balance with Canada. In 2014, the value of U.S. imports of intermediate agricultural products from Canada exceeded U.S. exports of those types of commodities to that country by $3.9 billion. This trade deficit narrowed to $3.2 billion in 2016. U.S. imports of bulk agricultural commodities from Canada surpassed U.S. exports of bulk commodities to that country by $2.3 billion in 2013. This trade deficit declined to $0.9 billion in 2016.
Figure 5. U.S. Net Agricultural Trade with Canada: Total and by Type of Commodity (Billion Dollars)
Table 1 shows 2012 to 2016 U.S. agricultural trade with Canada by type of commodity, including the top five agricultural commodities within each category. On the export side, the top five agricultural commodities shipped to Canada were prepared foods, fresh vegetables, fresh fruit, pork and products, and processed fruits, which are under the category of consumer-oriented agricultural products. These five groups of commodities represented 41% ($8.4 billion) of total agricultural exports to Canada last year ($20.5 billion). Also, these five groups of commodities made up 51% of total consumer-oriented agricultural products exported to Canada in 2016 ($16.5 billion). Overall, consumer-oriented agricultural commodities made up 80% of total U.S. agricultural exports to Canada in 2016.
U.S. intermediate agricultural products exported to Canada comprised 16% ($3.2 billion) of total agricultural exports to that country in 2016. Within this group, oils (essential and vegetables oils NESOI (not elsewhere specified or included)), feed ingredients (soybean meal and feed and fodders NESOI), and planting seeds, made up 8% ($1.6 billion) of total U.S. agricultural exports to Canada and 49% of total intermediate agricultural products exported to that country last year. U.S. bulk agricultural products represented only 4% of total agricultural exports to Canada in 2016. Rice, corn, pulses, soybeans, and peanuts made up 78%($0.6 billion) of total U.S. bulk exported to Canada ($0.8 billion) and 3% of total U.S. agricultural exports to that country in 2016.
On the import side, consumer-oriented agricultural products made up the largest component of U.S. agricultural imports from Canada, with a 62% ($13.5 billion) share of total agricultural imports in 2016 ($21.6 billion). Intermediate agricultural products and bulk products comprised the remaining 30% of value ($6.4 billion) and 8%($1.7 billion), respectively, in 2016. Across all groups, the United States’ main agricultural imports from Canada in 2016, by value, were: prepared foods ($3.0 billion), vegetable oil NESOI ($1.8 billion), live animal ($1.5 billion), chocolate and cocoa products ($1.4 billion), and fresh vegetables ($1.3 billion) (see Table 1).
Canada and the European Union Comprehensive Economic and Trade Agreement (CETA)
According to a USDA’s Global Agricultural Network Information (GAIN) report published on March 3, 2017, Canada and the European Union Comprehensive Economic and Trade Agreement (CETA), is a wide-ranging trade agreement that includes almost all Canada -EU trade, even agriculture. CETA is expected to be implemented this spring (estimated time June 1, 2017), and because of the concessions agreed-to under this trade, U.S. agricultural trade with Canada and EU could be negatively impacted. Once this agreement is implemented, U.S. agricultural exports to Canada could face increased competition with EU products. As indicated in the report, the EU will have unlimited duty-free access to the Canadian market for beef and pork. Canada will be receiving duty-free access to the EU market through tariff rate quotas (TRQs), which will be implement over a period of six years. For beef and pork, TRQs will be about 50,000 metric tons (MT) carcass weight equivalent (CWE) and 75,000 MT CWE, respectively. Overall, the USDA report indicates U.S. agricultural exports potentially facing increased competition from the EU include: meat and poultry (beef, pork, lamb and poultry products), grains, oilseeds, processed foods, fruits and vegetables, seafood, and alcoholic beverages. As reported by the U.S. Meat Export Federation, in 2016, the United States exported to Canada 105,460 metric tons of beef (muscle cuts only) and 191,691 metric tons of pork (muscle cuts only).
Table 1. U.S. Top Five Exports to and Imports from Canada by Type of Commodity (Billion Dollars)
The U.S. agricultural sector benefits from international trade as more than 20% of U.S. agricultural products are exported. Canada is the second-highest value market for U.S. agricultural products in general, and the top destination for U.S. exports of high-value agricultural products (consumer-oriented agricultural products). Bulk agricultural commodities such as corn and soybeans, on the other hand, do not have a strong presence in that market. In 2016 Canada ranked as the number 11 and number 21 market for U.S. corn and U.S. soybean exports, respectively.
The agricultural trade of the United States, Canada, and Mexico, has substantially increased since the NAFTA agreement was implemented in 1994. The U.S. intentions to renegotiate NAFTA have the potential to adversely impact U.S. agricultural exports to Canada and Mexico. In 2016, $38.4 billion worth of U.S. agricultural products were shipped to those two countries combined, representing 29% of total U.S. agricultural exports in 2016.
Want more news on this topic? Farm Bureau members may subscribe for a free email news service, featuring the farm and rural topics that interest them most!