National Crop Insurance Indemnities and Loss Ratios
Author
Published
3/30/2017
Two weeks ago, we published an article that showed how crop insurance has performed in Iowa. In addition to single year summaries, we looked at multi-year average corn and soybean loss ratios from revenue-based crop insurance products available to Iowa producers.
Given what was learned in the prior analysis we have extended the research to look at how revenue-based crop insurance has performed in the rest of the United States. We also broadened the crops under study to include wheat and cotton, crops not widely grown in Iowa.
What we found, for example, was that the lowest percentage of counties that had loss ratios greater than one for corn was 14% in 2005 (see Figure 1). Conversely, the year with the highest percentage of counties with loss ratios greater than one was 2012 when 47% of all counties had loss ratios greater than one (see Figure 2).
To see these maps, along with those for other years and crops, we invite readers to visit the video at this link.
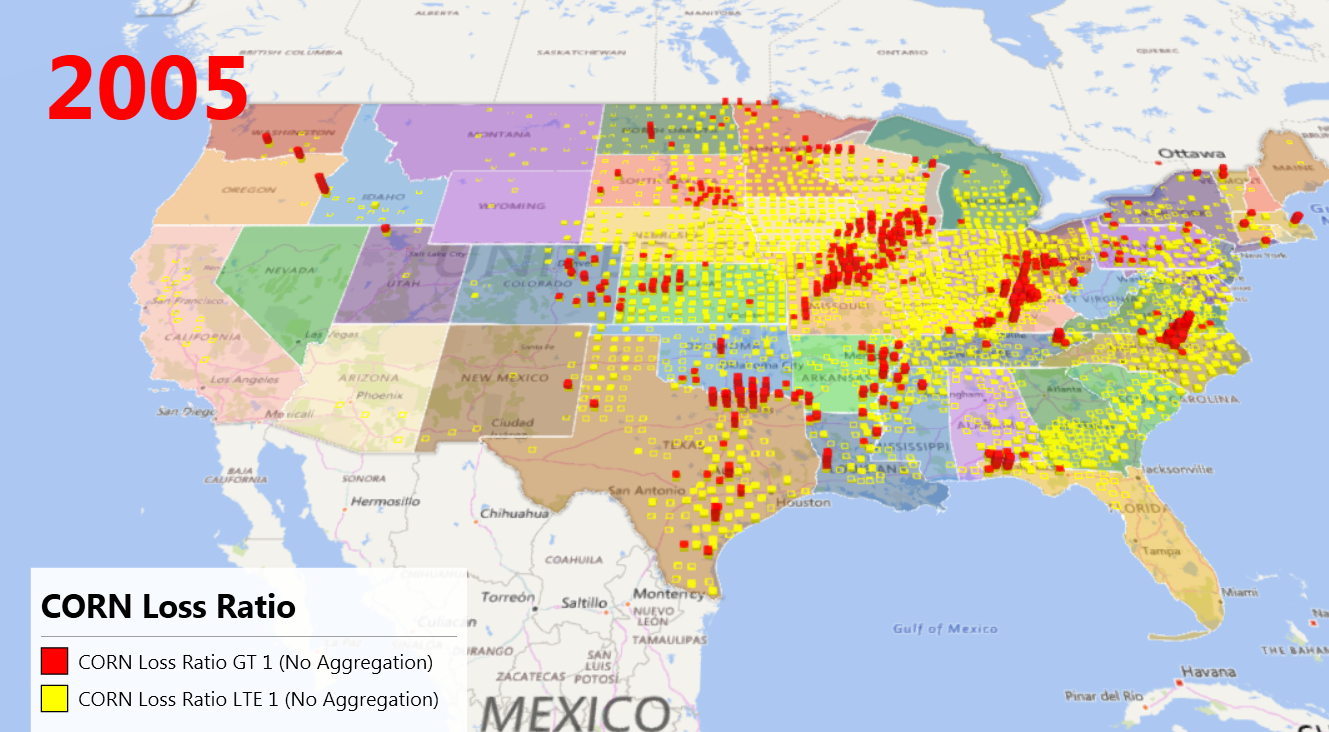
Figure 1, Minimum Share of Counties Exceeding Loss Ratio of One (Corn)
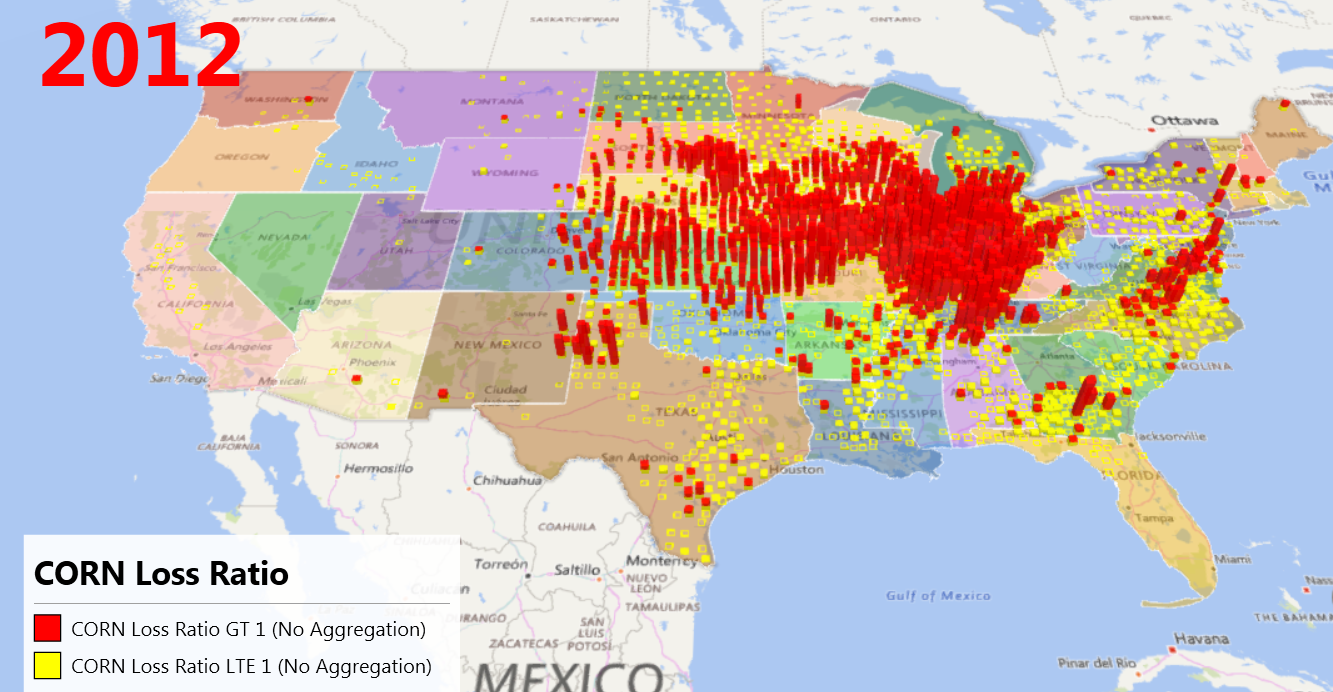
Figure 2, Maximum Share of Counties Exceeding Loss Ratio of One (Corn)
Want more news on this topic? Farm Bureau members may subscribe for a free email news service, featuring the farm and rural topics that interest them most!