Multi-Year Average Loss Ratios for Iowa County Crop Insurance
Author
Published
3/16/2017
We recently put together a brief article on the actuarial performance of corn and soybean crop insurance premiums in Iowa from 2001-2015. This article was patterned after work done by Carl Zulauf and Gary Schnitkey from Farmdoc Daily in Illinois.
Using the data that supports both the Farmdoc Daily article and the one produced for Iowa Farm Bureau, we have expanded upon the resources available to visually show the frequency and intensity of corn and soybean crop insurance indemnities and loss ratios in Iowa over time.
An additional aspect of loss ratios not originally covered in the first report is that of multi-year average calculated loss ratios. Multi-year average loss ratios were calculated at 3-yr, 5-yr, 10-yr and 15-yr increments. Figure 1 and Figure 2 are maps of these four multi-year loss ratios for both Iowa corn and soybeans. Figure 3 and Figure 4 show what the 15-yr average loss ratios are for corn and soybeans, respectively. Additionally, the red portions of each column denote Iowa counties in which the 15-yr average loss ratio exceeded one (i.e., when 15-yr average indemnities exceeded 15-yr average total premiums). As shown in these two figures, the majority of counties that have 15-yr average loss ratios exceeding one are in south-central Iowa.
To see these map, along with many others, we invite readers to visit the video at this link.
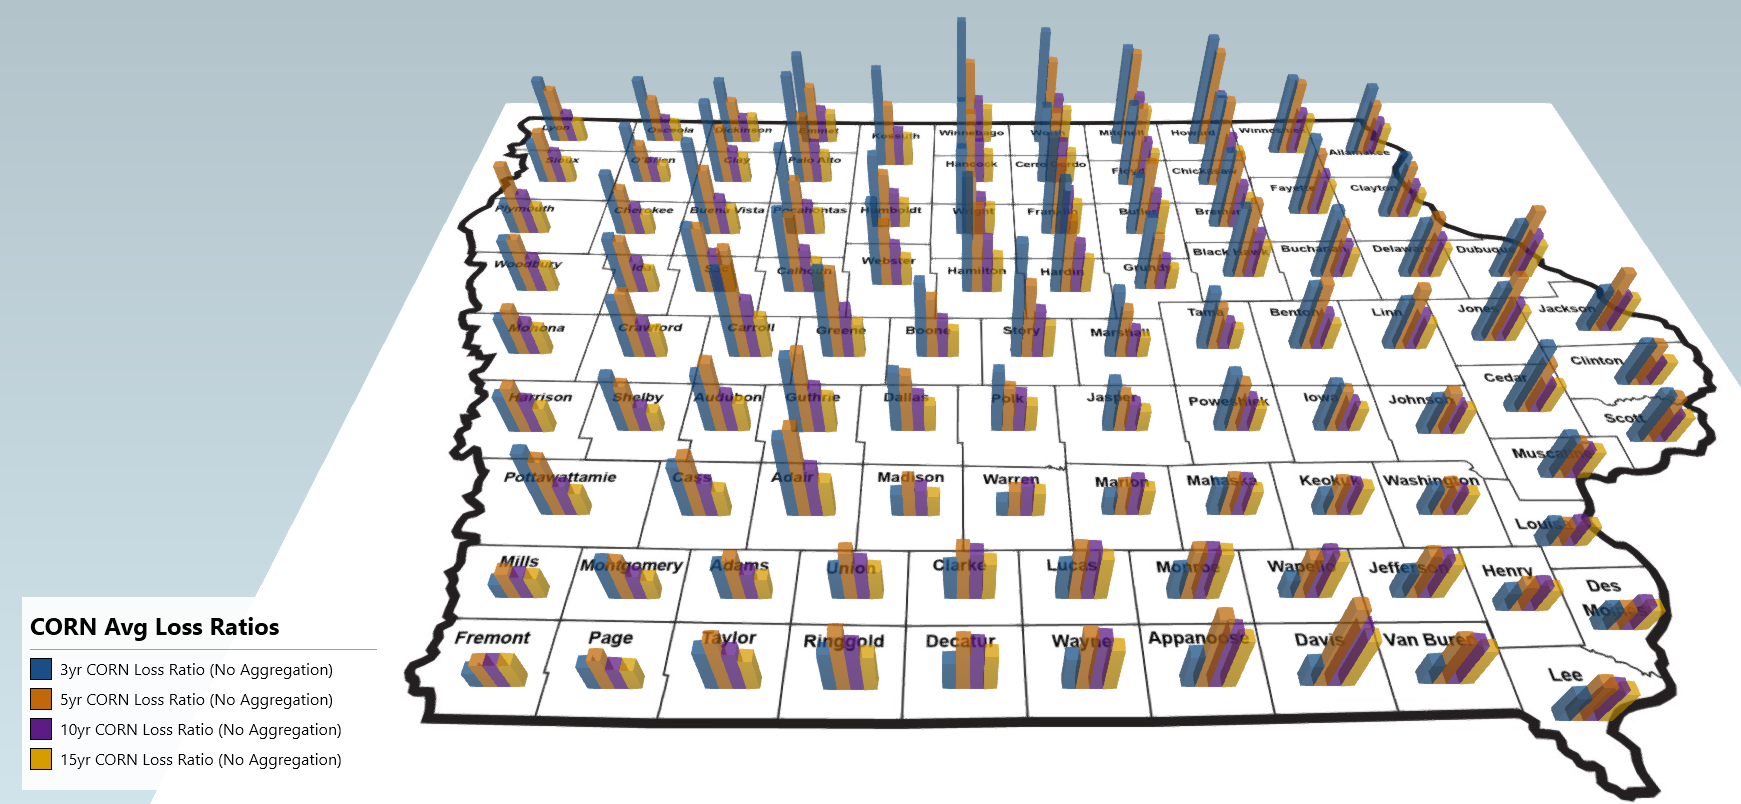
Figure 1, Corn Multi-Year Average Loss Ratios
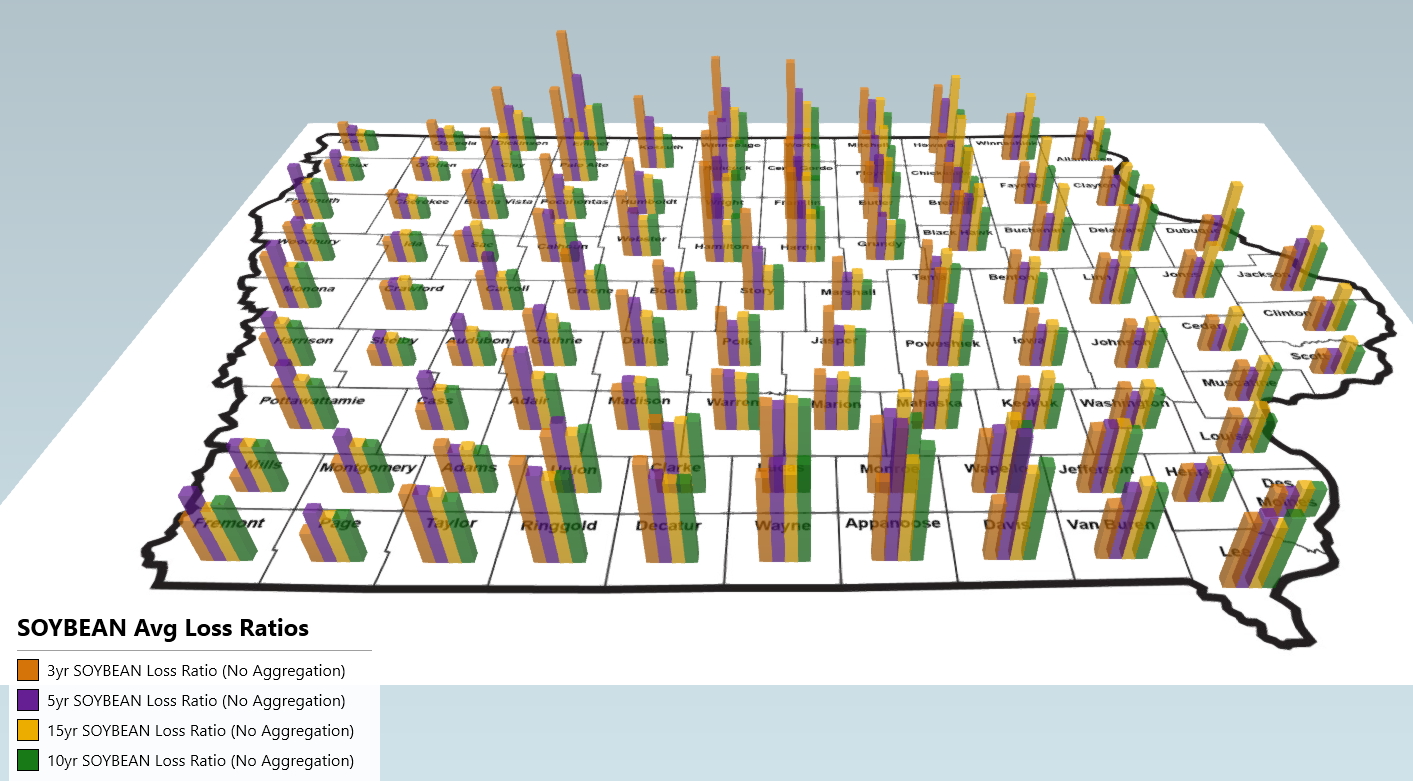
Figure 2, Soybean Multi-Year Average Loss Ratios
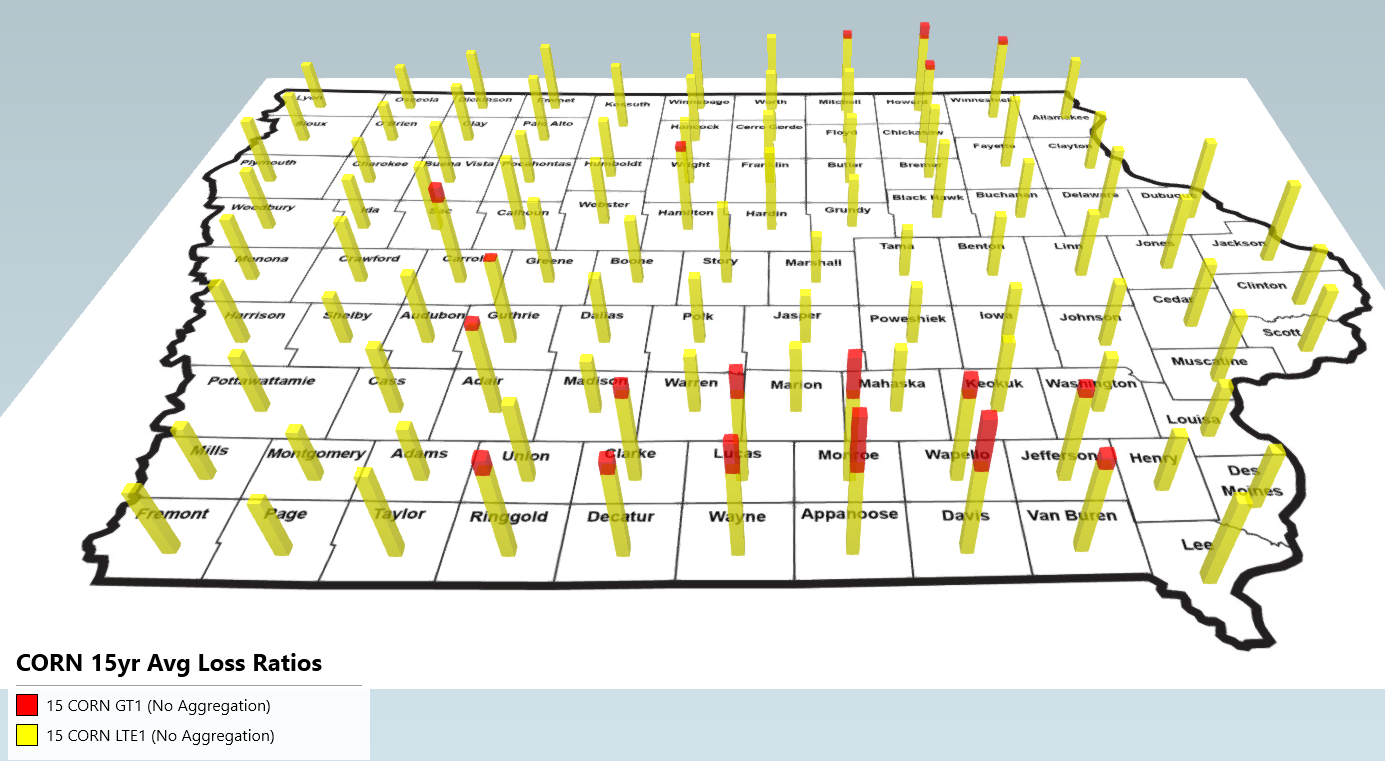
Figure 3, Corn 15-yr Average Loss Ratios
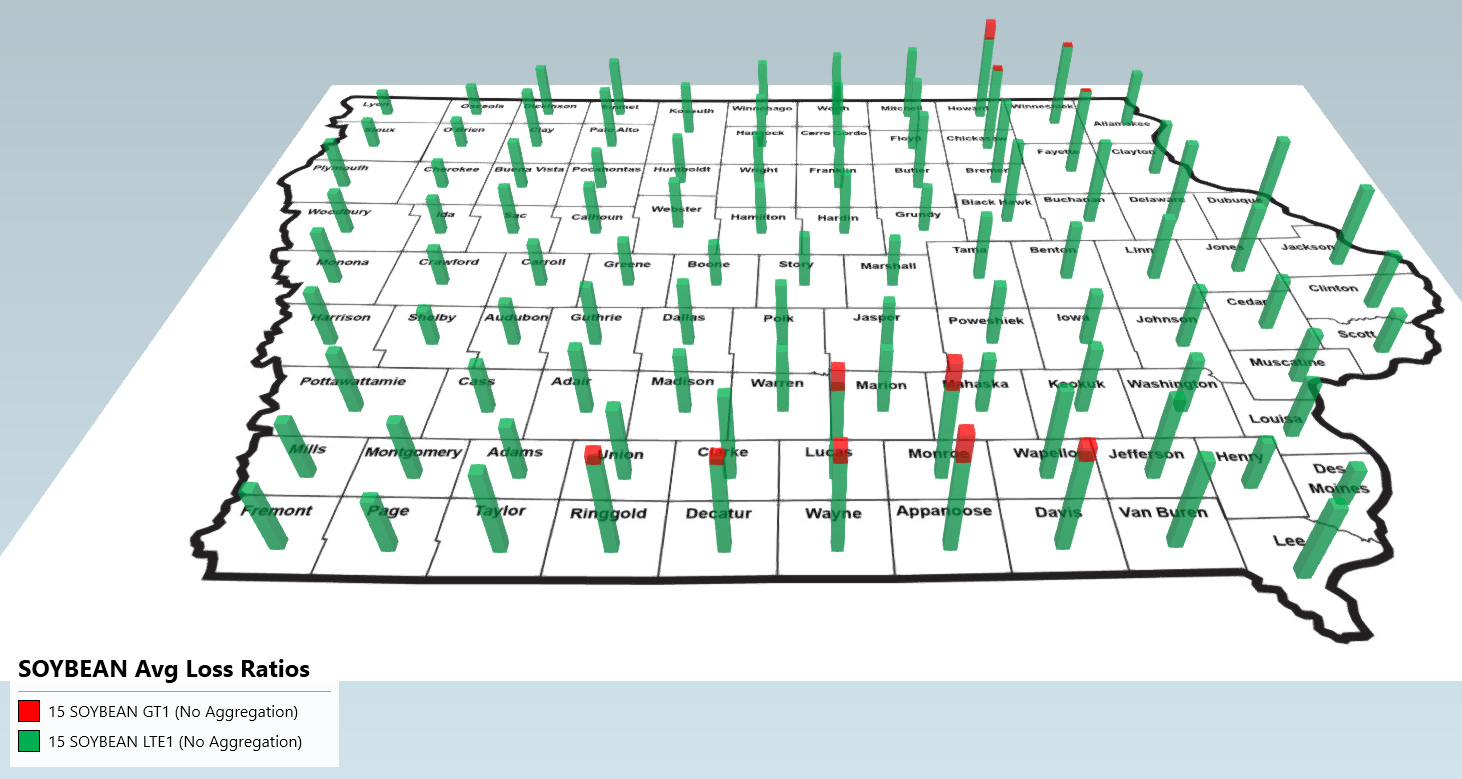
Figure 4, Soybean 15-yr Average Loss Ratios
Want more news on this topic? Farm Bureau members may subscribe for a free email news service, featuring the farm and rural topics that interest them most!