Mississippi Barge Rate Update
Author
Published
3/30/2023
Last fall, low water levels on the Mississippi River pushed barge rates to record high levels (Figure 1). Average barge rates reached over $105 per ton ($3.15/bushel for soybeans and $2.94/bushel for corn) at their peak in early October 2022. Since then, barge rates have returned to more normal levels around $18 per ton ($0.54/bu for soybeans), as precipitation has brought the river level back up.
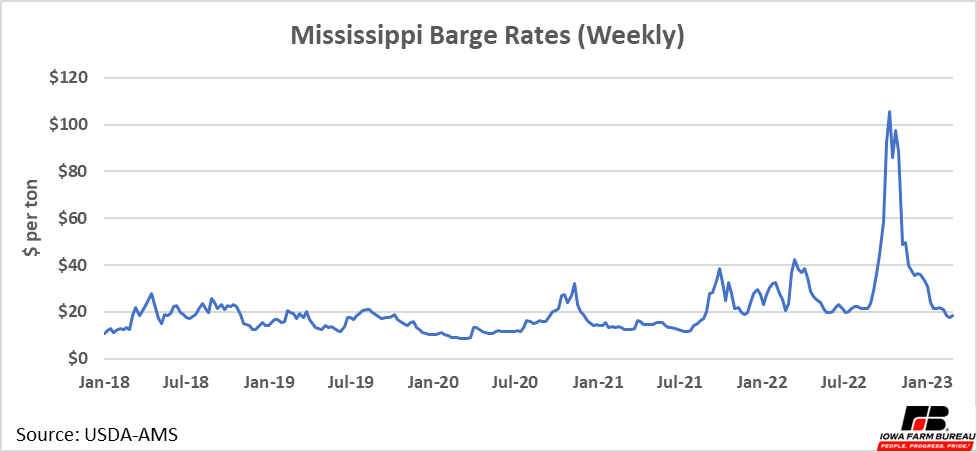
Figure 1. Mississipppi Barge Rates
Due to the low river levels, grain shipments down the Mississippi noticeably decreased. In late September and early October, shipments are typically lower. However, the low river levels in 2022 made fall shipments much lower than the typical seasonal drop (Figure 2).
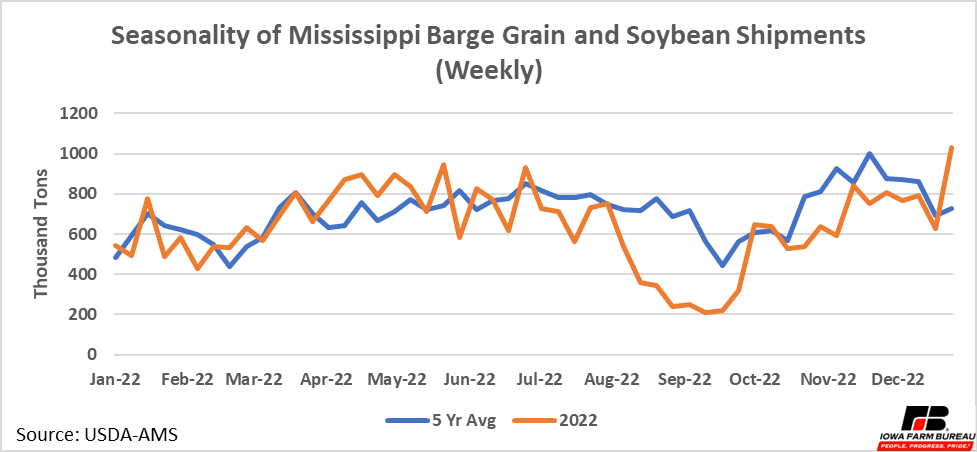
Figure 2. Seasonality of Mississippi Barge Grain and Soybean Shipments
Barges are a major transport mode for US exports of corn and soybeans. Figure 3 and Figure 4 show the percentage of corn and soybeans exports by final mode of transportation before export. This does not include ocean vessels that commodities would be loaded on to for export if they are not going directly to Canada or Mexico by land.
About 50% of corn exports and about 60% of soybean exports are on a barge before they are exported. With the vast majority of US barge traffic on the Mississippi, problems with transport on the Mississippi can be significant to US corn and soybean exports.
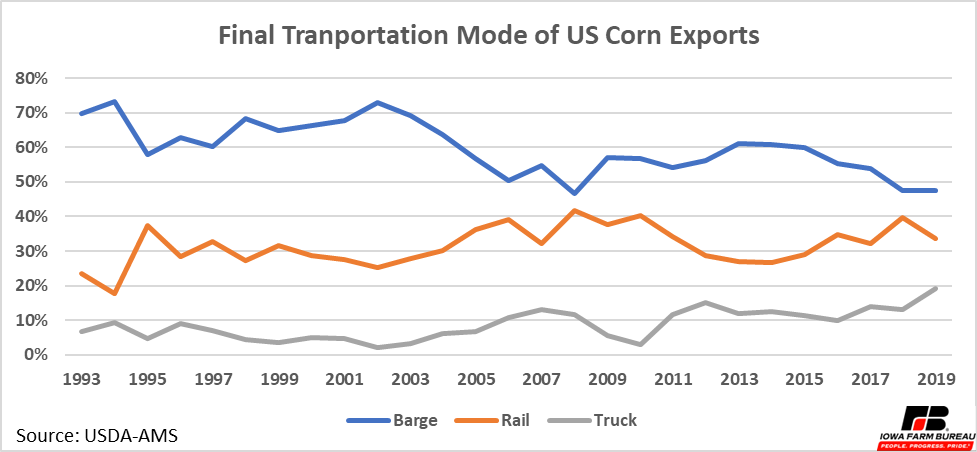
Figure 3. Final Transportation Model of US Corn Exports
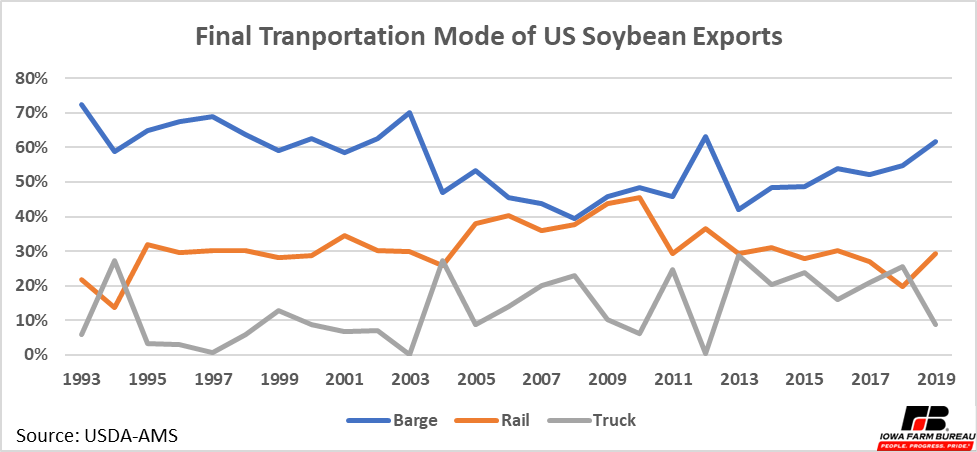
Figure 4. Final Transportation Mode of US Soybean Exports
US corn and soybeans exports have been slow during the marketing year. Figure 5 and Figure 6 show corn and soybean exports relative to projected exports based on the current WASDE projection and the historic data. Corn exports continue to lag behind the WASDE projection while soybean exports have recently surpassed the WASDE projection despite a slow start.
While a strong dollar and weaker foreign demand also played a role in slowing exports, higher transportation costs due to higher barge rates and simply the inability to move a large amount of grain down the Mississippi may also have been a factor.
Now that barge rates and Mississippi grain shipments have returned to more normal levels, we’ll see if exports, especially corn exports, gain any steam through the back half of the marketing year, or if weaker foreign demand continues to keep exports lower than in years past and the current WASDE estimate.
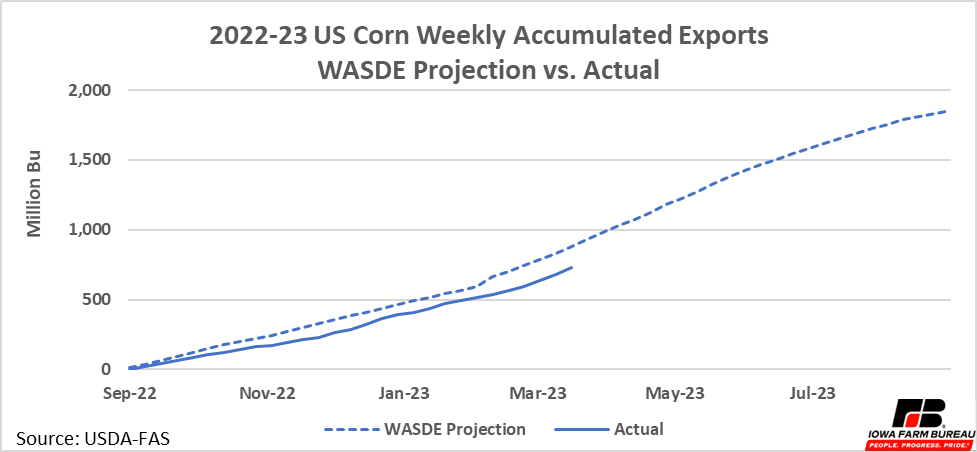
Figure 5. 2022-23 US Corn Weekly Accumulated Exports WASDE Projection vs. Actual
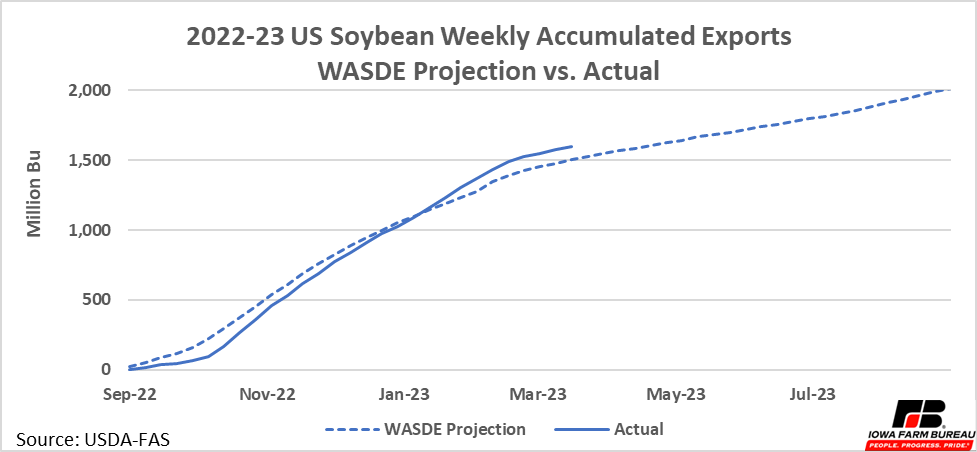
Figure 6. 2022-23 US Soybean Weekly Accumulated Exports WASDE Projections vs. Actual
Economic analysis provided by Aaron Gerdts, Research Analyst, Decision Innovation Solutions on behalf of Iowa Farm Bureau.
Want more news on this topic? Farm Bureau members may subscribe for a free email news service, featuring the farm and rural topics that interest them most!