Margins in the Beef Supply Chain
Author
Published
8/22/2022
Introduction
Many agricultural industries, especially livestock industries, have become vertically integrated. The beef industry is not one of those industries with cow-calf producers, feedlots, packers, and retailers for the most part operating as separate entities. This puts more focus on margins at various stages of the beef supply chain compared to other agricultural commodities. Moreover, the COVID-19 pandemic had large impacts on the beef supply chain bringing even more focus to price spreads within the beef industry. This article examines price margins between feeders and fed cattle, fed cattle and wholesale beef, and wholesale beef and retail beef. All margins discussed are gross margins, not profit margins. Costs for each group in the supply chain are not included in the gross margin and would need to be accounted for to calculate profit margins.
Fed Cattle Margin
The first major margin in the cattle supply chain is the margin between the price cow-calf producers receive for feeder cattle and the price feedlots receive for fed cattle, or the feedlot margin. The prices of feeders and live cattle are shown in Figure 1 on a live basis. Feeder cattle prices are adjusted by a factor of 2.25 to convert to a live fed cattle basis. The feedlot margin is also given. The feedlot margin has been fairly consistent, fluctuating between $20 and $50 per hundredweight over the past 20 years. The margin was lowest around 2015, when U.S. cattle numbers were nearing the end of a herd reduction period. Total U.S. cattle and calves peaked over 130 million in the 1970’s but decreased slowly after that (Figure 2). Total cattle and calves in the U.S. went as low as 88 million in January 2014, a level not seen since the 1950’s. The low cattle numbers lead to higher beef prices, creating more demand for feeder cattle, and limiting the margin between feeder cattle and fed cattle. Higher beef prices also brought a new herd expansion period beginning in 2015.
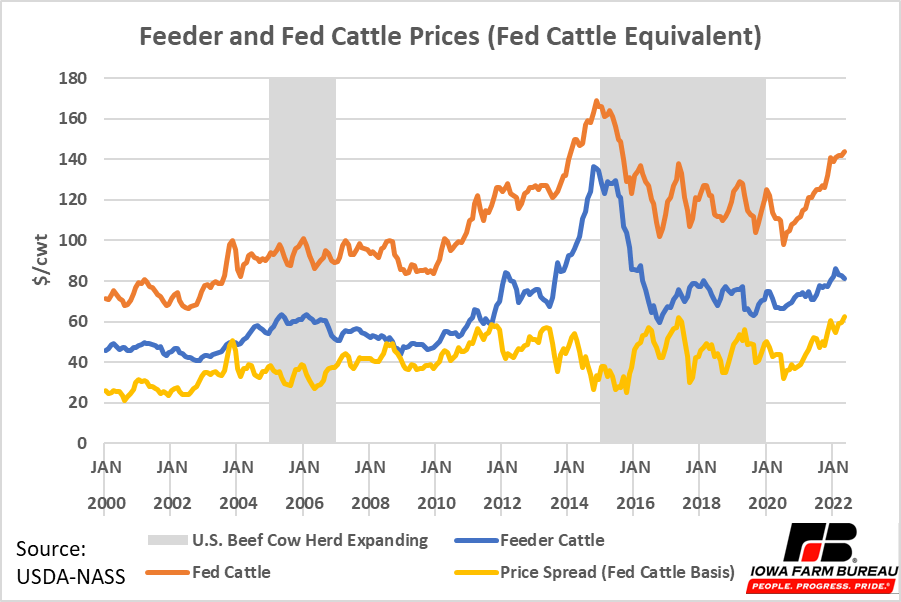
Figure 1. Feeder and Fed Cattle Prices (Fed Cattle Equivalent)
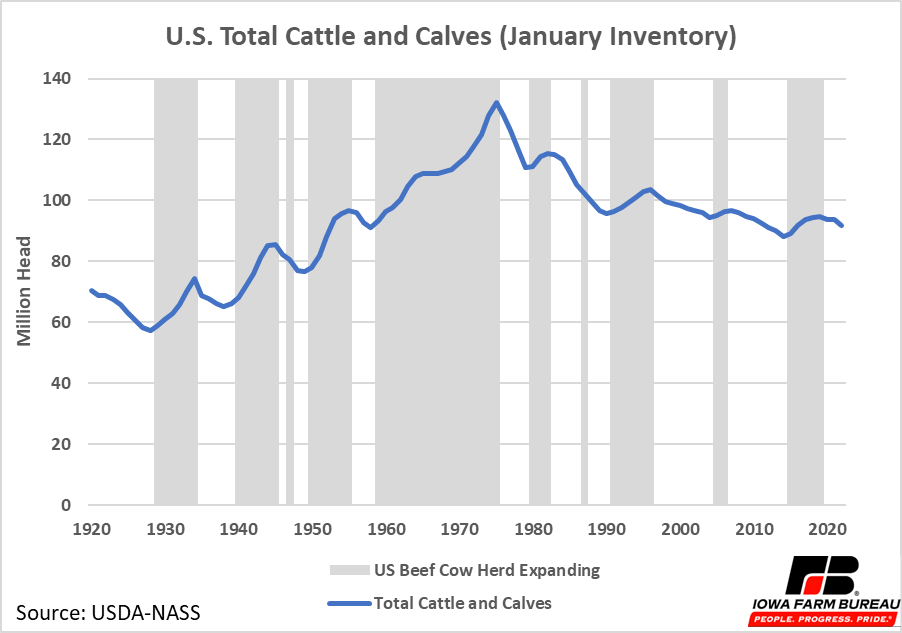
Figure 2. U.S. Total Cattle and Calves (January Inventory)
Wholesale Margin
The next margin in the supply chain is the fed cattle to wholesale margin, or the wholesale margin. Fed cattle values, wholesale values, and the wholesale margin from 2000 to the present are given in Figure 3. Prices have been converted to 1000 lb. steer equivalent which means the price is in terms of product per pound. The wholesale margin remained relatively constant until 2015, when it began increasing slowly until 2020 when major spikes occurred (yellow line in Figure 3).
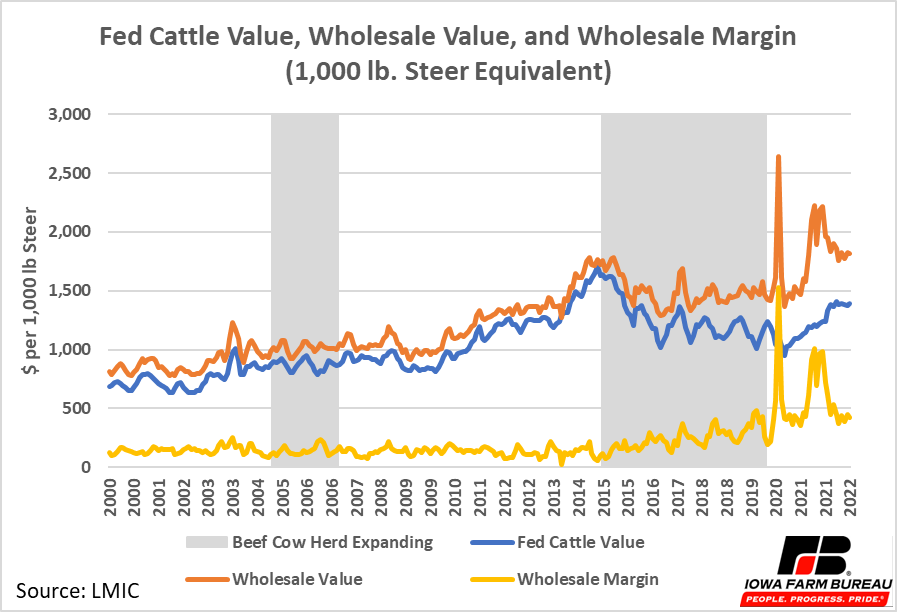
Figure 3. Fed Cattle Value, Wholesale Value, and Wholesale Margin (1,000 lb. Steer Equivalent)
Increases in the wholesale margin can occur for a variety of reasons. Market power is one possibility that is commonly suggested. The beef packing industry is extremely consolidated with four firms controlling over 80% of the market, and packers could be using market power to increase their margins. However, other factors could also raise margins in a competitive market. For example, if costs across the whole packing industry increase, prices rise to offset these additional costs. No market power is present, yet prices and gross margins still rise.
To better understand market forces that could be influencing the wholesale margin, this article examines the wholesale margin in three different periods. The three periods this article examines are:
Period 1: January 2015 to March 2020. Prior to this period the wholesale margin had been consistent for a long period. During this period the wholesale margin on a retail weight equivalent slowly increased from around $150 per 1,000 lb. steer to almost $500 per 1,000 lb. steer. Furthermore, the margin appears to cyclically rise and fall. The margin had fallen back to around $200 per 1,000 lb. steer prior to the pandemic following the apparent cyclical pattern.
Period 2: April 2020 to June 2020. This is a short period at the beginning of the COVID-19 pandemic. During this period a large spike in the wholesale margin occurred. The margin spiked at $1,527 per 1,000 lb. steer before falling back around $100 per 1,000 lb. steer.
Period 3: July 2020 to the present. During this period the wholesale margin started near the high of Period 1, around $ per 1,000 lb. steer, then increased to over $1,000 per 1,000 lb. steer in June 2021. The margin remained in the range of $600 to $1000 per 1,000 lb. steer until December 2021 when it began to return near $400 per 1,000 lb. steer. This somewhat resembles the cyclical spikes in Period 1, but with a bigger and longer spike.
Wholesale Margin – Period 1
Let’s start by examining market forces in Period 1. Previous decreases in slaughter capacity and an expanding in the cattle herd are likely explanations for the gradual increase in the wholesale margin during this period.
As the U.S. cattle inventories change, packers are expected to adjust their capacity. In a competitive market, packers would like to have just enough slaughter capacity to handle all available cattle. Excess capacity would mean unused space, under-utilized labor resources, and a higher fixed cost per head. A lack of capacity would lead to plants running at very high levels of capacity utilization and more hours on weekends with higher costs such as additional overtime hours.
As noted earlier, U.S. January cattle inventories peaked over 130 million head in the 1970’s and put in a recent low of 88 million head in 2014 (Figure 2). As the U.S. herd declines packers slowly decreased total capacity. Then the herd then went through an expansion period from 2015 to 2019 and reached around 95 million head. The beginning of the expansion period coincides with the beginning of Period 1, which is when the wholesale margin began to increase.
Data of total U.S. slaughter capacity is not publicly available, but inferences can be made about slaughter capacity by looking at other data, like total slaughter data. Figure 4 displays average daily steer and heifer slaughter for each day of the week. There are signs that U.S. slaughter capacity has decreased. Saturday slaughter is the most volatile day of the week. Saturday slaughter decreased in 2009, a few years into a U.S. herd reduction period. This makes sense as excess slaughter is usually reduced on Saturday first. As the U.S. herd continued to decline to record low levels, Saturday slaughter remained low. Additionally, Monday through Friday average slaughter has been slowly decreasing over time. It noticeably declined from 2013 to 2015 when the herd was at record low levels. When the herd began expanding again in 2015, Saturday slaughter increased but Monday through Friday slaughter did not. This supports the notion that as the U.S. herd inventory declined prior to 2015, and when the herd began expanding in 2015, packers were faced with capacity constraints as the first way to increase weekly capacity was to increase Saturday slaughter rather than increasing daily slaughter capacity.
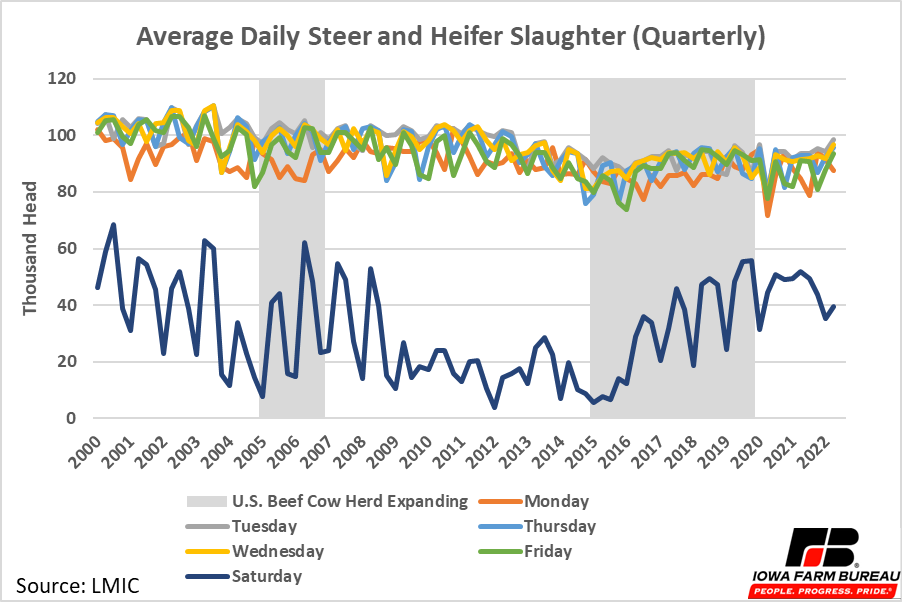
Figure 4. Average Daily Steer and Heifer Slaughter (Quarterly)
Further evidence U.S. slaughter capacity declined is presented in Figure 5. Figure 5 shows the maximum daily steer and heifer slaughter in each quarter. Notice, Monday through Friday slaughter maximum daily slaughter slowly decreased to lows in 2015 and 2016. Maximum Monday through Friday slaughter has generally remained below 100,000 since 2013 except for a few instances. Even as the U.S. herd expanded from 2015 to 2019, maximum daily slaughter did not increase as high as levels seen prior to 2013 when similar cattle inventories were present.
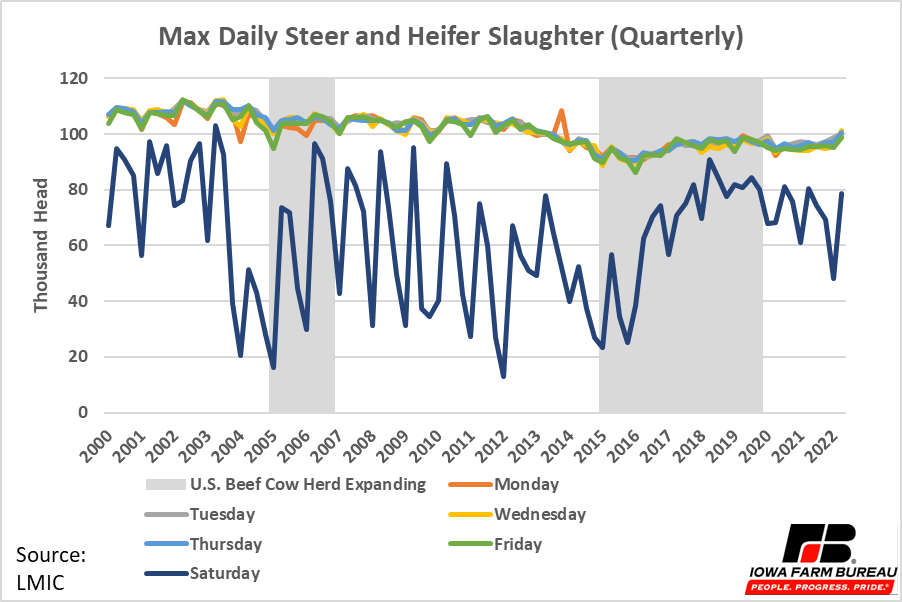
Figure 5. Maximum Daily Steer and Heifer Slaughter (Quarterly)
Daily slaughter averages and maximums suggest U.S. cattle slaughter capacity has decreased. Given slaughter capacity has decreased, changes in the wholesale margin become easier to explain. The wholesale margin is expected to increase slowly over time to cover industry costs that also increase over time due to inflation. However, from 2000 to 2015, the wholesale margin remained relatively constant. It is likely that during this period packers had excess capacity that was built when cattle inventory was much higher. When packers have excess capacity and are operating competitively, in the short term the best practice is to process as many animals as possible to spread fixed costs as thin as possible. This puts downward pressure on the wholesale margin. In the long term, when packers have excess capacity, they are expected to slowly reduce their capacity.
In 2015, the packing industry likely had reduced slaughter capacity enough that the cattle expansion cycle in 2015 eventually led to packers operating over capacity for the first time in many years. This is supported by the fact that Saturday slaughter increased in 2016, shortly after the expansion period began, but weekday slaughter did not. This also coincides with the time the wholesale margin began rising suggesting the margin increased at least in part, due to increased costs from operating over normal capacity. Prices paid for beef remained the same while increased costs incurred by the packing industry were passed along the supply chain, resulting in a higher wholesale margin.
When a firm is using market power, quantity is expected to decrease when margins increase. But, when firms are operating competitively and facing increased costs from over-capacity operations, margins are expected to increase when quantity increases. Figures 6 & 7 show the relationship on a weekly basis between the wholesale margin and steer and heifer slaughter capacity utilization and percent of total steers and heifers slaughtered on Saturday. Slaughter capacity utilization was estimated by taking total weekly slaughter divided by the maximum Monday-Friday slaughter during the previous year. It is not a perfect measure but does show general trends in cattle slaughter over time. Notice the trend lines in Figure 6 & 7 both slope up from left to right. This means as both capacity utilization and Saturday slaughter increase, the packer margin increases, which is more consistent with a market with capacity constraints than a market with market power.
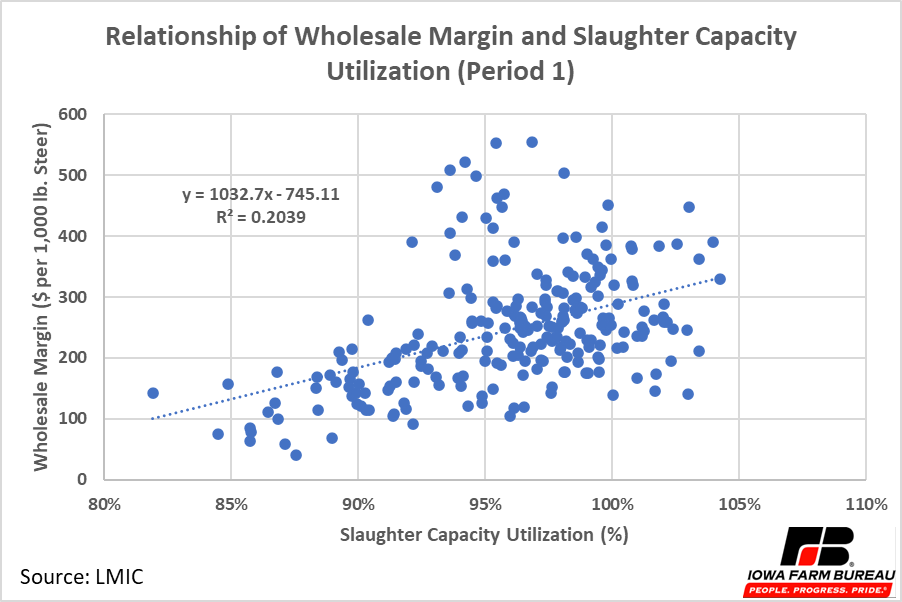
Figure 6. Relationship between Slaughter Capacity Utilization and the Wholesale Margin (Period 1)
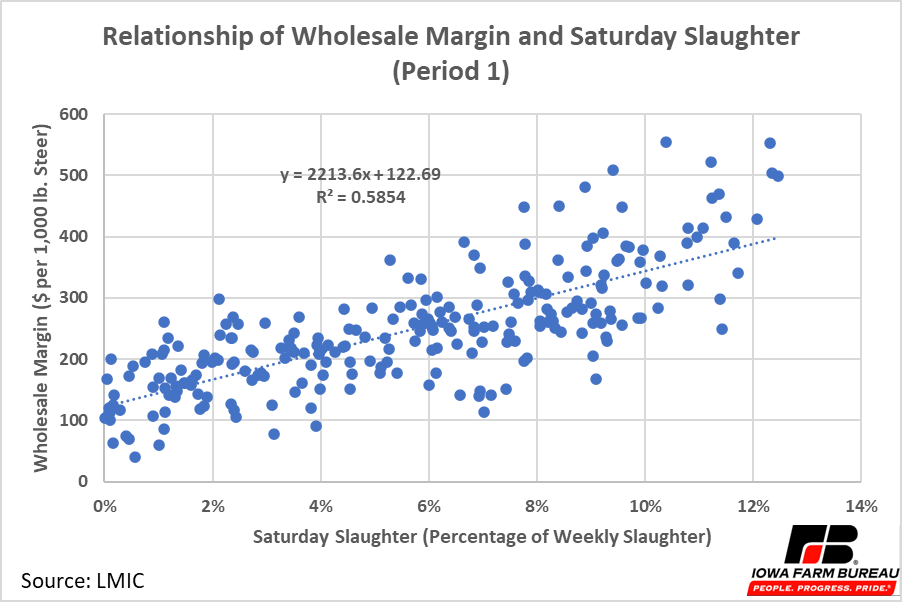
Figure 7. Relationship of Wholesale Margin and Saturday Slaughter (Period 1)
Wholesale Margin – Period 2
Moving on, the most extreme spike in the wholesale margin occurred in Period 2. The marketing channel disruptions of the COVID-19 pandemic were likely the primary contributors to this large spike. At the beginning of the COVID-19 pandemic, many packing plants saw reduced throughput and some temporarily shut down as workers became infected with COVID-19. U.S. cattle slaughter was reduced dramatically. A reduction in throughput raises a packer’s fixed costs on each animal for packing plants as there are less animals to spread the fixed costs over. Increased fixed costed were passed onto the retailers in the form of higher prices. Also happening at this time were major disruptions in marketing channels with significant increases in demand for beef packaged for retail sales and less demand for beef packaged for hotel, restaurant and institutional (HRI) sales.
Figures 8 & 9 show the relationship between the wholesale margin and steer and heifer slaughter capacity and Saturday steer and heifer slaughter in Period 2. Unlike Period 1, the trend lines for Period 2 slope up from right to left, indicating that as slaughter capacity and Saturday slaughter decrease, the margin increased. Remember, when market power is present, typically quantity falls and price rises because the producer, in this case the packer, choses to lower production or raise price. Given the short-term market effects created by COVID-19, it seems unlikely that market power was the cause of this spike in the wholesale margin. Disruptions caused by the pandemic forced packers to lower production. This created additional costs for packers which caused the wholesale margin to increase, but also caused favorable short-term market conditions. The supply of processed beef packers had to sell fell because packers could not process as many animals, which caused prices to rise. Furthermore, less cattle were able to be slaughtered. As the supply of cattle available to slaughter rose, this put downward pressure on the fed cattle prices, so fed cattle prices did not climb with wholesale prices. As packers worked through the pandemic and began operating at full capacity again, wholesale margins fell back to previous levels as the supply of wholesale beef expanded the supply of cattle available for slaughter was slowly reduced,
In short, the large spike in Period 2 was likely due to a combination of increased costs experienced by packers and favorable short-term market conditions. Market power likely was not a factor in this period as packers reduced capacity because they had to, not because they chose to.
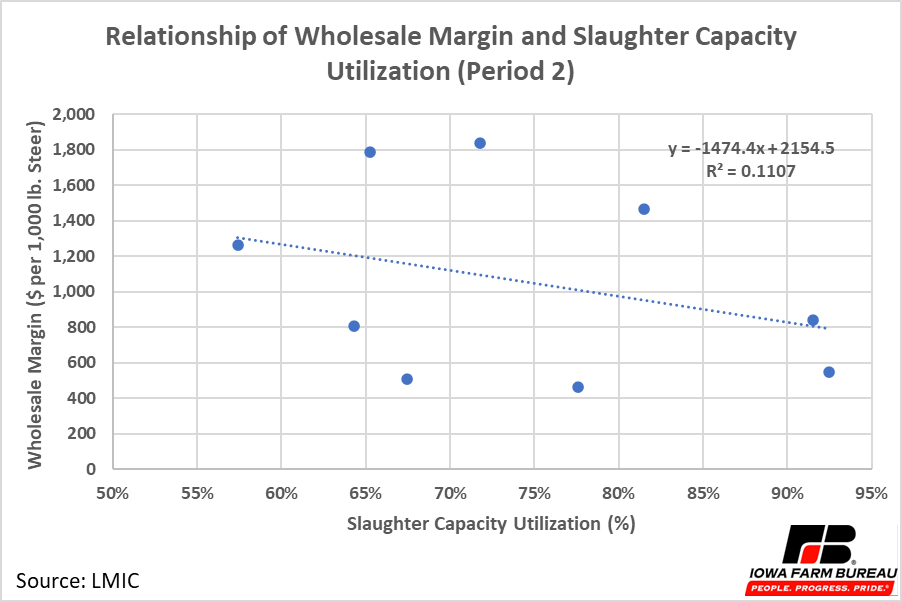
Figure 8. Relationship of Wholesale Margin and Slaughter Capacity Utilization

Figure 9. Relationship of Wholesale Margin and Saturday Slaughter
Wholesale Margin – Period 3
The final period outlined above is Period 3. In Period 3 the wholesale margin began near highs posted in Period 1, which as outlined earlier, was caused at least in part by reduced slaughter capacity. Figures 10 & 11 show the relationship between the wholesale margin and steer and heifer slaughter capacity and Saturday steer and heifer slaughter in Period 3. In both graphs neither slaughter capacity utilization nor Saturday slaughter is highly correlated with the wholesale margin. Or stated another way, changes in slaughter utilization and Saturday slaughter do not explain the changes in the wholesale margin in Period 3.
Market power is a possible reason for the high wholesale margin in Period 3, as slaughter capacity utilization and Saturday slaughter do not explain changes in the wholesale margin. Another explanation is the inflation and supply chain issues that were prevalent across the whole economy. Increased costs for nearly everything from packaging materials, transportation, and labor allowed price increases at the wholesale level to largely be retained by packers and not passed down the marketing chain to producers contributing to the spike in the wholesale margin in Period 3.
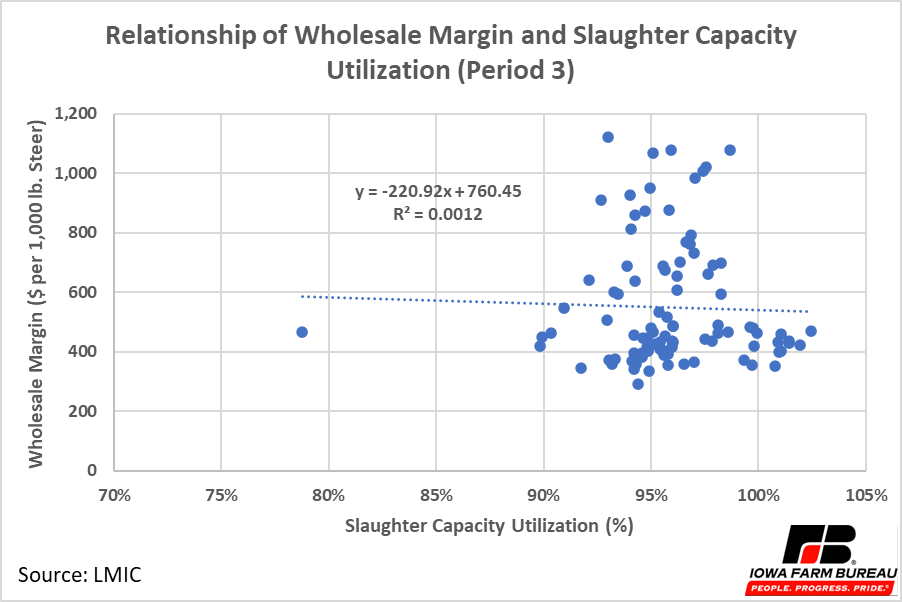
Figure 10. Relationship of Wholesale Margin and Slaughter Capacity Utilization
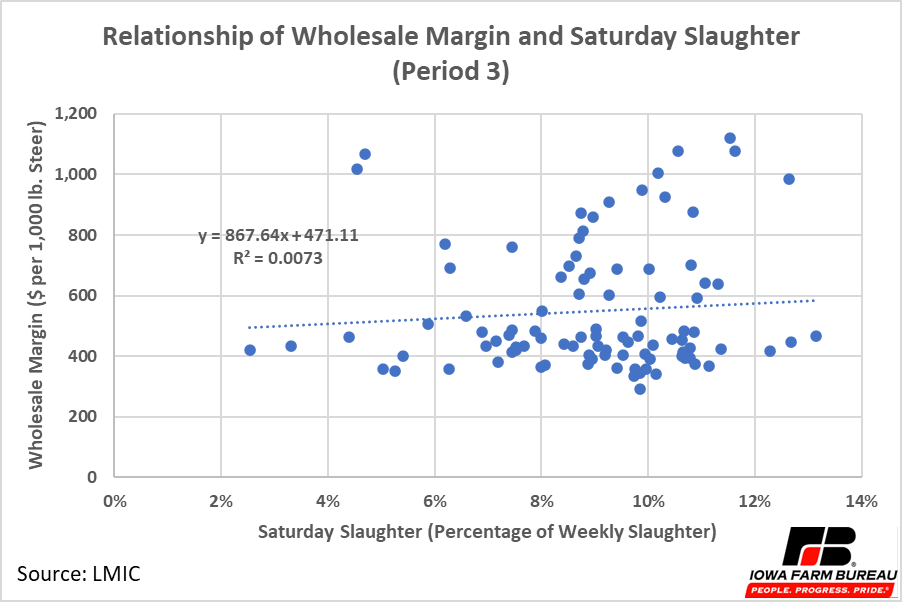
Figure 11. Relationship of Wholesale margin and Saturday Slaughter (Period 3)
Wholesale Margin - Conclusion
After examining the wholesale margin in three separate periods there are a few important conclusions to outline. Reduced slaughter capacity, the pandemic, and inflation were all likely contributors to increases in the packer margin. These factors do not mean no market power exists in the beef packing industry, but they do illustrate other factors outside of market power can cause the wholesale margin to increase. Previous economic research confirms some market power does exist in the packing industry. As noted in a Texas A&M University report, “While not necessarily a popular position, most economic research confirms that the benefits to cattle producers due to economies of size in packing largely offset the costs associated with any market power exerted by packers. Research indicates that there is market power, but its effect has been small.”1 (cattle.pdf (tamu.edu)).
Retail Margin
The last margin in the supply chain is the wholesale to retail margin, or the retail margin. Wholesale values, retail values, and the retail margin from 2000 to the present are given in Figure 12. Prices are on a retail basis which means the price is in terms of retail product per pound. The retail margin has steadily increased from just over $100 per hundredweight in 2000 to over $350 per hundredweight in 2022 (blue line in Figure 8).
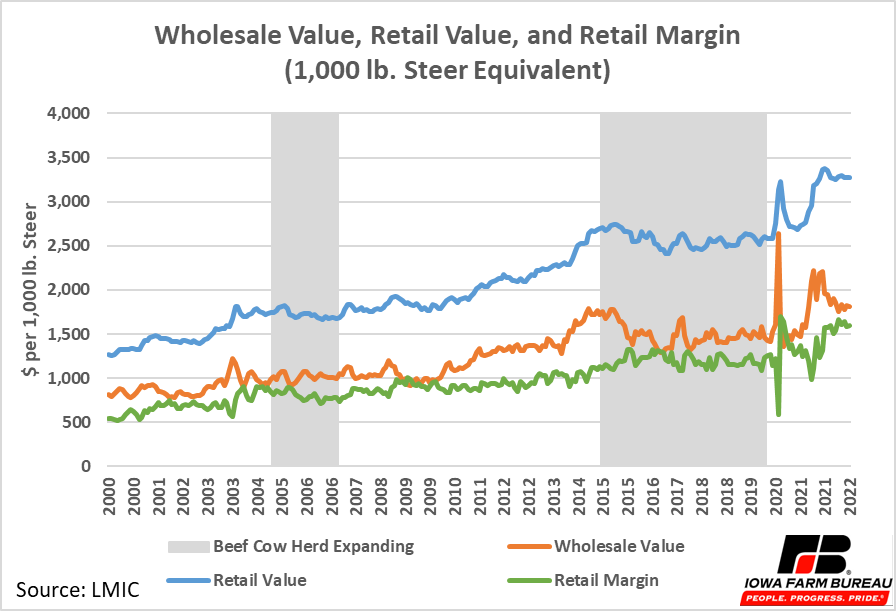
Figure 12. Wholesale Value, Retail Value, and Retail Margin (1,000 lb. Steer Equivalent)
From 2015 to 2020 before the pandemic, the retail margin was fairly level, moving between $250 per hundredweight to $300 per hundredweight following fluctuations in the wholesale margin that were occurring at the same time. When the pandemic hit and wholesale prices for products destined for retail trade rose significantly due to reduced slaughter throughput as discussed earlier, retailers were not able to pass all their additional costs to consumers and their margins fell. When wholesale prices fell, the retail margin increased again. The next time wholesale prices increased significantly in 2021, the retail margin also fell for a brief time but then increased as retailers raised prices high enough to cover the additional costs of wholesale beef and other inflationary cost pressures. Moreover, when wholesale beef prices declined after the spike in 2021, retail prices remained relatively constant, leading to a higher retail margin.
Conclusion
The major price margins in the beef industry are the fed cattle margin, wholesale margin, and retail margin. The fed cattle margin has remained relatively stable over time. The wholesale margin remained stable until 2015 when it began slowly increasing. This was likely due at least in part to slaughter capacity constraints which to some degree reflect exertion of market power in the wholesale market since relatively few firms control the majority of packer capacity. The pandemic created a large spike in the wholesale margin in 2020. After the pandemic, the packer margin has remained higher than it was prior to the pandemic, but this is at least in part been caused by inflation affecting the whole economy. From a producer perspective, monitoring the wholesale margin moving forward is important, especially after the high inflation environment ends. The retail margin has steadily increased over time. Like the wholesale margin, the retail margin was also greatly affected by the pandemic and monitoring it for some return to normalcy when the inflation returns to normal levels is warranted.
Economic analysis provided by Aaron Gerdts, Research Analyst, Decision Innovation Solutions on behalf of Iowa Farm Bureau.
Want more news on this topic? Farm Bureau members may subscribe for a free email news service, featuring the farm and rural topics that interest them most!