March 2026 WASDE
Author
Published
3/17/2026
The USDA released its updated WASDE report on March 10th, 2026.
(Current) 2025/26 Marketing Year
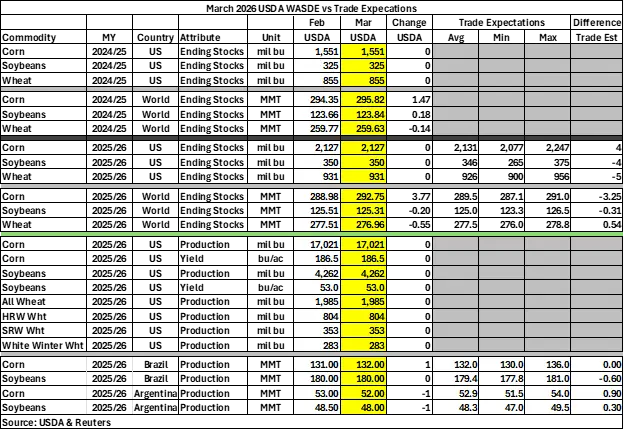
March adjustments to the USDA’s supply and demand estimates were minimal, which is customary for this time of year. U.S. corn, soybean, and wheat ending stocks, production, and yield estimates remain unchanged from February to March. Corn ending stocks fell 4 million bushels (mb) short of trade expectations, while soybean and wheat ending stocks slightly exceeded expectations by 4-5 mb.
World corn ending stocks increased by 3.77 million metric tons (MMT) to 292.75 MMT, outperforming market expectations by 3.25 MMT. World soybean and wheat ending stocks both marginally decreased to 125.31 MMT and 276.96 MMT respectively while aligning with industry expectations.
(Prior) 2024/25 Marketing Year
U.S. corn, soybean, and wheat ending stocks, production, and yield estimates remain unchanged.
For the world, corn ending stocks rose by 1.47 MMT to 295.82 MMT and soybean ending stocks increased slightly to 123.84 MMT. Wheat ending stocks decreased by 0.14 MMT to 259.63 MMT.
South American Markets
The USDA’s Brazil corn production estimate increased by 1 MMT as expected to 132.00 MMT and soybean production estimates remained at 180.00 MMT exceeding expectations by 0.60 MMT. Argentina’s corn production estimates decreased by 1 MMT to 52.00 MMT, which is 0.90 MMT less than expected. Argentina’s soybean production estimates fell by half a MMT to 48.00 MMT, falling under expectations by 0.30 MMT.
Table 1 shows some key report estimates for both U.S. and World production.
Table 1. March 2026 USDA WASDE
Initial Market Reaction
March corn futures initially fell by about a cent to $4.31 before rising over the next few hours to $4.36. May corn futures initially fell from $4.50 to $4.47 but started surging and reached a high of $4.53 by midafternoon. July corn futures followed the trend, initially falling from $4.61 to $4.58 before rising through the afternoon to $4.64.
Soybean futures initially increased by 3-4 cents. March soybean futures rose from $11.86 to $11.90 but regressed to $11.85. May and July soybean futures followed the trend, increasing by 3 cents initially $12.05 and $12.17 respectively.
March soybean meal futures fell from $1/ton to $311.7. May and July soybean meal futures initially increased by $7-8/ton to $315.7/ton and $318.4/ton.
Soybean oil futures decreased by about 55 cents per pound initially. May soybean oil futures rose to 66.42 cents per pound before falling to 65.88 per pound by midafternoon. July soybean oil futures increased 66.02 cents per pound, but declined throughout the afternoon to 65.50 cents per pound. August soybean oil futures rose to 65.11 cents per pound, but fell to 64.57 cents per pound during the afternoon.
Wheat futures fell by about 6 cents before surging through the afternoon. May wheat futures first decreased to $5.84 and rose throughout the afternoon to $5.93. July wheat futures fell to $5.98, but recovered to $6.05 by the afternoon. September wheat futures fell to $6.09, but climbed to $6.18.
Changes to Domestic Balance Sheets
This section summarizes changes to the corn and soybean balance sheets in more detail.
For corn, there were no changes in the 2024/25 or 2025/26 balance sheets
Table 2. March 2026 WASDE Corn Balance Sheet

For soybeans, there were no changes in the 2024/25 balance sheet. In the 2025/26 balance sheet, imports increased by 5 mb to 25 mb, resulting in the total supply also expanding to 4,612 mb. Soybean crush is the destination of this import, increasing to 2,575 mb. Therefore, total domestic and total use increased to 2,687 mb and 4,262 mb respectively. Soybean ending stocks and expected farm price per bushel remained constant.
Table 3. March 2026 WASDE Soybean Balance Sheet

Want more news on this topic? Farm Bureau members may subscribe for a free email news service, featuring the farm and rural topics that interest them most!