Markets React as USDA Releases First Look at 2026/27 Estimates
Author
Published
5/14/2026
Introduction
The USDA released its updated WASDE report on May 12th, 2026. The May report is highly anticipated as it introduces the U.S. and world supply and demand estimates for the 2026/27 marketing year
(New) 2026/27 Marketing Year
U.S. corn ending stocks are projected to be 1,957 million bushels (mb), exceeding average trade expectations. U.S. soybean stocks are forecasted to be 310 mb, falling well short of average trade expectations (364 mb). Wheat ending stocks are expected to be 762 mb, underperforming industry expectations of 833 mb.
World corn ending stocks are projected to be 277.54 million metric tons (MMT), nearly 12 MMT short of trade expectations. World soybean ending stocks are forecasted to be 124.78 MMT, only 1.91 MMT less than expectations. World wheat ending stocks are predicted to be 275.04 MMT, falling 5.80 MMT short of expectations.
2025/26 Marketing Year
U.S. ending stocks increased by 15 mb to 2,142 mb and exceeded trade expectations by 11 mb. Soybean ending stocks fell by 10 mb to 340 mb, falling short of average expectations by 5 mb. Wheat ending stocks dipped slightly to 935 mb and aligned with industry expectations.
World corn ending stocks increased by 2.14 MMT to 296.95 MMT and world soybean ending stocks rose slightly to 125.13 MMT. World wheat stocks fell by nearly 4 MMT to 279.21 MMT.
South American Markets
For the 2026/27 marketing year, Brazil is expected to produce 139 MMT of corn and 186.00 MMT of soybeans and Argentina is expected to produce 59 MMT of corn and 48 MMT of soybeans.
For the 2025/26 marketing year, Brazil’s corn production estimate increased by 3 MMT to 135 MMT and Argentina’s corn production estimate jumped by 7 MMT to 59 MMT. The soybean production estimates remain unchanged.
Table 1 shows some key report estimates for both U.S. and world production.
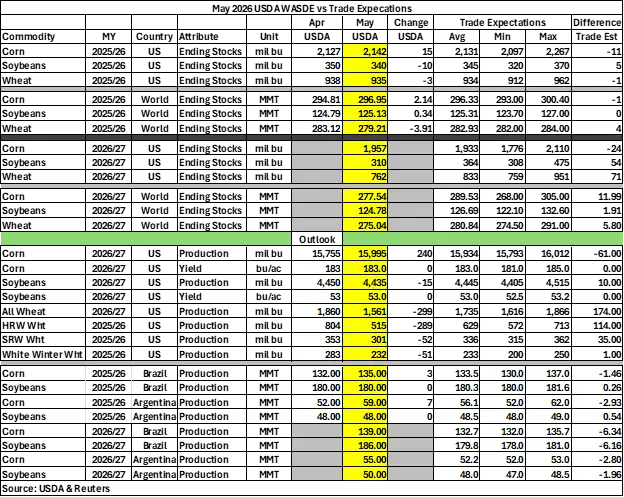 Image Caption
Table 1. May 2026 USDA WASDE vs. Market Expectations
Initial Market Reaction
May corn futures initially fell by 1 cent to $4.64 before trending upwards to $4.66. July corn futures initially spiked by 4 cents to $4.80 before falling to $4.73 shortly after. It improved throughout the afternoon to $4.78. September corn futures followed the same trend, initially rising to $4.86, before falling to $4.79, but improved to $4.85 throughout the afternoon.
May soybean futures were trending upward prior to the WASDE being released and continued the trend, rising to $12.13. July soybean futures initially surged by 13 cents to $12.31 before falling to $12.25 throughout the afternoon. August soybean futures followed the same trend, rising to $12.25 before falling to $12.19 later in the day.
May soybean meal futures trended upwards to $334.1/ton after the WASDE released. July soybean meal futures initially increased by $3/ton to $329.7/ton and fell to $328.6/ton throughout the day. August soybean meal futures initially rose to $324.7/ton but dropped to $323.3/ton by midafternoon.
May soybean oil futures were trending downwards and fell to 75.50 cents per pound. July soybean oil futures initially fell by about 0.21 cents per pound before rising throughout the afternoon to 75.29 cents per pound. August soybean oil futures initially fell to 73.00 cents per pound before increasing in the afternoon to 73.73 cents per pound.
Wheat futures jumped by 18-20 cents immediately after the WASDE released and fluctuated before rising another 7-8 cents. July wheat futures initially increased to $6.71 and rose to $6.79 throughout the day. September wheat futures initially jumped to $6.84 and rose to $6.91 by midafternoon. December wheat futures first increased to $7.04 and later jumped to $7.09.
Changes to Domestic Balance Sheets
This section summarizes changes to the corn and soybean balance sheets in more detail. Since this month is the first with supply and demand estimates for the new marketing year, the 2026/27 balance sheet will be compared to the USDA outlook forum in February.
Table 2 displays the May 2026 WASDE corn balance sheet. For the 2025/26 marketing year, food, seed, and industrial decreases by 15 mb, which resulted in the same change in total domestic and total use. Ending stocks rose by 15 mb to 2,142 mb and expected average farm price per bushel stayed constant at $4.15.
For the 2026/27 marketing year, area planted and harvested both increased by 1.3 million acres to 95.3 million acres and 87.4 million acres respectively from February’s outlook. The production estimate jumped by 240 mb to 15,995 mb, resulting in the same change in total supply. Feed and residual increased by 100 mb to 6,100 mb and food, seed, and industrial fell by 15 mb to 6,955 mb, leading total domestic to increase by 85 mb to 13,055 mb. Exports jumped by 50 mb to 3,150 mb, resulting in total use rising by 135 mb to 16,025 mb. Ending stocks rose by 120 mb to 1,957 mb and average farm price increased by 20 cents to $4.40 per bushel.
Table 2. May 2026 WASDE Corn Balance Sheet

Table 3 displays the May 2026 WASDE soybean balance sheet. For the 2025/26 marketing year, crush increased by 20 mb to 2,630 mb resulting in total domestic rising to 2,742. Exports fell by 10 mb to 1,530 mb, shifting to total use increasing to 4,272 mb. Ending stocks decreased by 10 mb to 340 mb and average farm price increased by 10 cents to $10.40 per bushel.
For the 2026/27 marketing year, area planted (84.7 million acres) and harvested (83.7 million acres) both decreased slightly from the February outlook by 0.3 million acres. U.S. soybean production estimates fell by 15 mb to 4,435 mb and imports jumped by 5 mb to 25 mb. These changes resulted in the total supply estimate falling by 20 mb to 4,800 mb. Crush jumped by 95 mb to 2,750 mb and seed and residual rose by 1 mb to 110 mb, leading to total domestic increasing by 96 mb to 2,860 mb. Exports fell by 70 mb to 1,630 mb, which combined with the change in total domestic results in total use falling by 26 mb to 4,490 mb. Ending stocks have dropped by 45 mb to 310 mb since the February outlook and expected average farm price per bushel has increased by $1.10 to $11.40 over the same period.
Table 3. May 2026 WASDE Soybean Balance Sheet

Want more news on this topic? Farm Bureau members may subscribe for a free email news service, featuring the farm and rural topics that interest them most!