Iowa Regional Crop Use in 2021: Corn and Soybeans
Author
Published
12/13/2022
Iowa is the top producer of corn in the nation and the second largest producer of soybeans, after Illinois. At the same time, several industries within the state depend on the production of these two crops, among them are the livestock and poultry industries and the renewable fuel industries, such as those producing ethanol and biodiesel. The production of these two crops contributes to Iowa’s position as the leader in pork, eggs, ethanol, and biodiesel production. This report presents the estimated volumes of these crops consumed by the different industries within Iowa at the county level in 2021, as well as, inflows and outflows of corn and soybeans into the state.
Corn
In 2021, Iowa produced 64.5 million metric tons (MT) of corn, at the same time, 15.0 million MT of corn were used to meet the state corn feed demand by the livestock and poultry industries. Sixty two percent of corn demand was due to corn for market hogs, while 20% of the corn demand was for cattle on feed. The top three counties in terms of corn demand for feed were Sioux (7.8%), Lyon (5.0%), and Washington (4.1%) counties (see Figure 1).
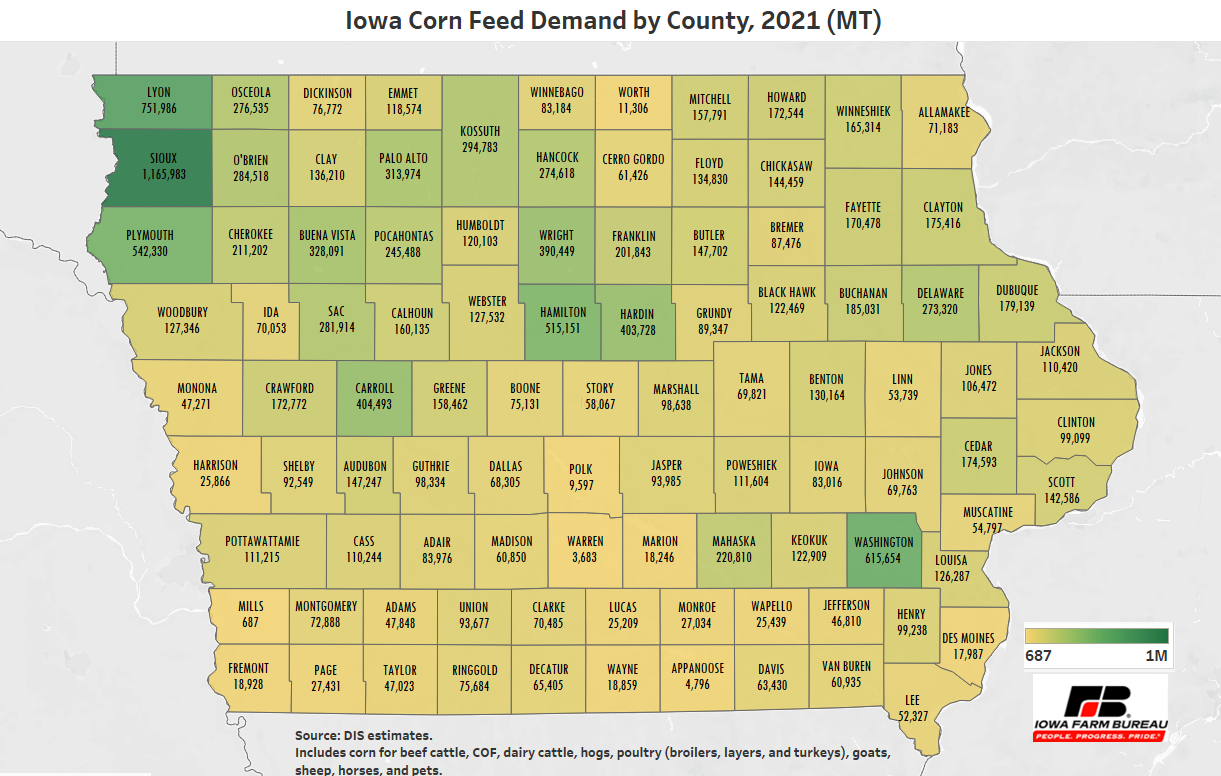
Figure 1. Iowa Corn Feed Demand by County, 2021 (MT)
In addition, 39.1 million MT of corn were used to meet Iowa’s ethanol industry demand, with a capacity of 4.3 billion of gallons of ethanol per year. The volume of corn demanded by the ethanol industry in Iowa made up 60.6% of total corn production in the state in 2021. The demand for corn for ethanol was distributed among 35 counties in the state. Base on plant capacity installed in 2021, three of these counties made up 20.6% of total corn demand for ethanol: Webster (8.1), Linn (7.0%), and Clinton (5.5%) (see Figure 2).
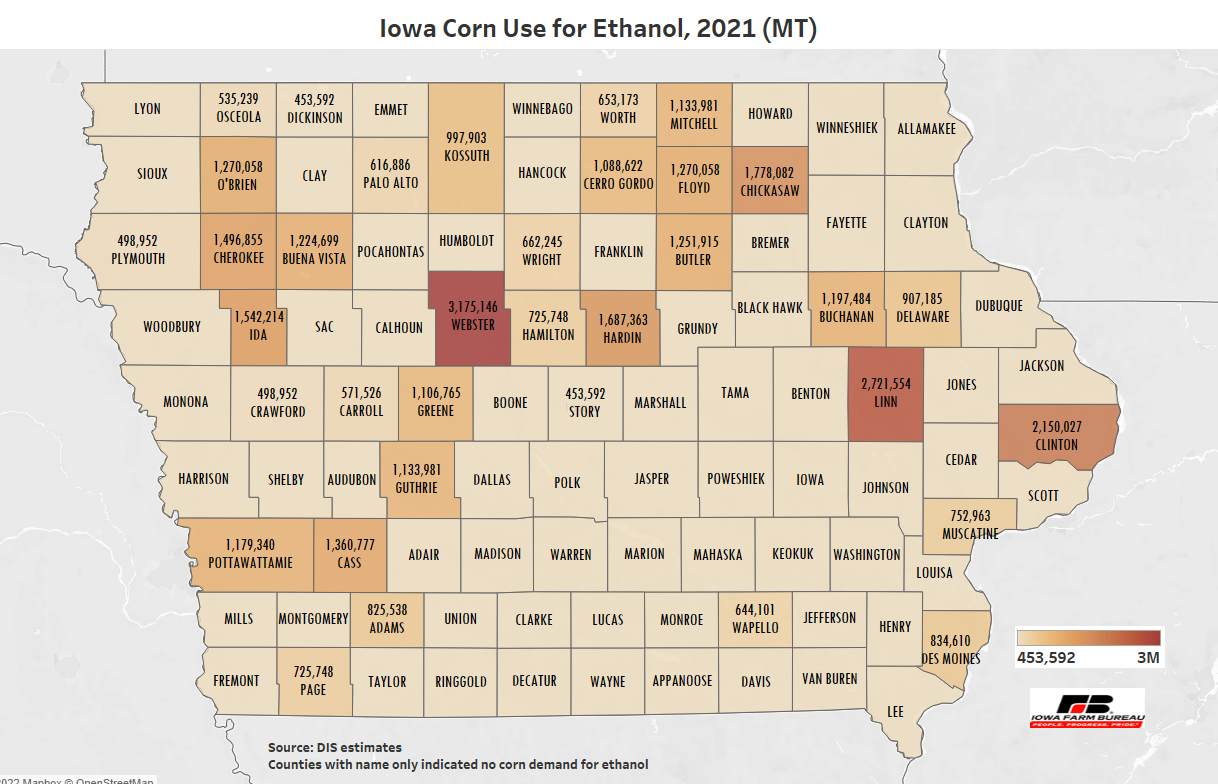
Figure 2. Iowa Corn Use for Ethanol, 2021 (MT)
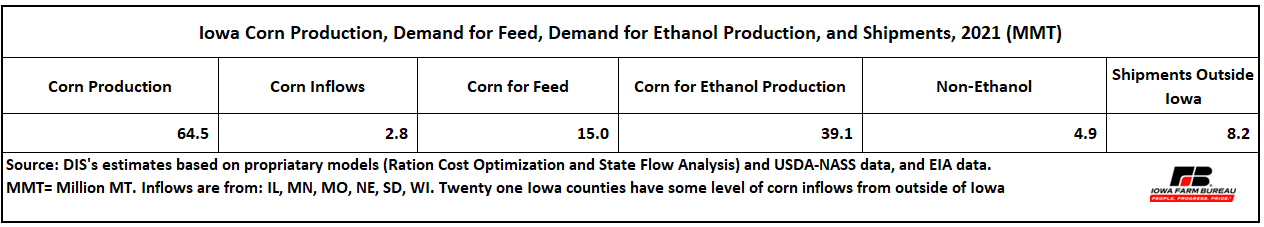
After meeting the corn demand for feed by the animal industry and for feedstock by the ethanol industry, and considering 2021 corn production, corn inflow into the state, as well as the use of corn for other purposes (non-ethanol), these estimates indicate Iowa was able to ship outside the state about 8.2 million MT of corn in 2021 (see Table 1).
Table 1. Iowa Corn Production, Demand for Feed, Demand for Ethanol Production, and Exports, 2021 (MT)
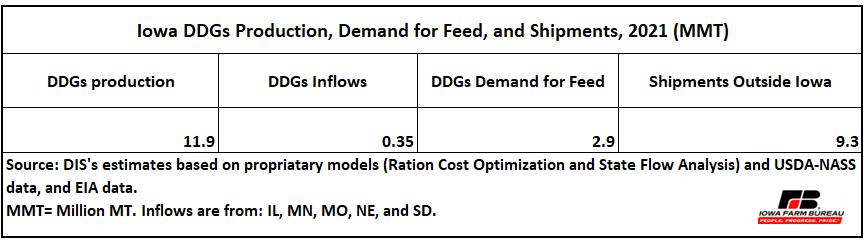
In 2021, the ethanol industry in Iowa produced 11.9 million MT of DDGs, a co-product of the ethanol production. The same year, the demand for DDGs by the animal production industry in Iowa reached a volume of 2.9 million MT. Leaving 9.3 million MT of DDGs for shipments out of the state of Iowa in 2021 (see Table 2).
Table 2. Iowa DDGs Production, Demand for Feed, and Exports, 2021 (MT)
Soybeans
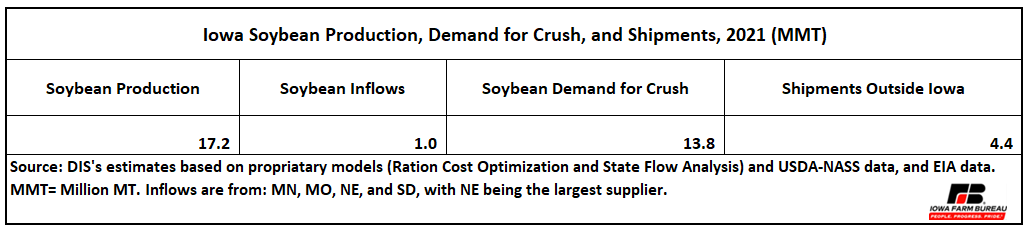
Iowa soybean production reached a volume of 17.2 million MT in 2021. Considering soybean production, soybean inflows into the state, and crush capacity, Iowa shipments outside the state were about 4.4 million MT of soybeans in 2021 (see Table 3). Based on soybean crush capacity in the state, 13.8 million MT of soybeans were processed in 2021, which were equivalent to 10.9 million MT of soybean meal (SBM), which also resulted in about 2.5 million MT of soybean oil (SBO).
Table 3. Iowa Soybean Production, Demand for Crush, and Exports, 2021 (MT)
In 2021, 2.7 million MT of SBM (about 3.5 million MT of soybean) were demanded by the livestock and poultry industries in Iowa. SBM for market hogs in the state consumed 66.8% of total SBM demand in 2021, followed by 20.1% used by the poultry industry. SBM for layers accounted for 13% of state total SBM demand in 2021 and 65% of the total demand by the poultry industry in the state. Sioux County was at the top in terms of SBM demand in 2021 with 5.8% of state total demand, followed by Washington County (4.7%) and Hamilton County (4.5%) (see Figure 3).
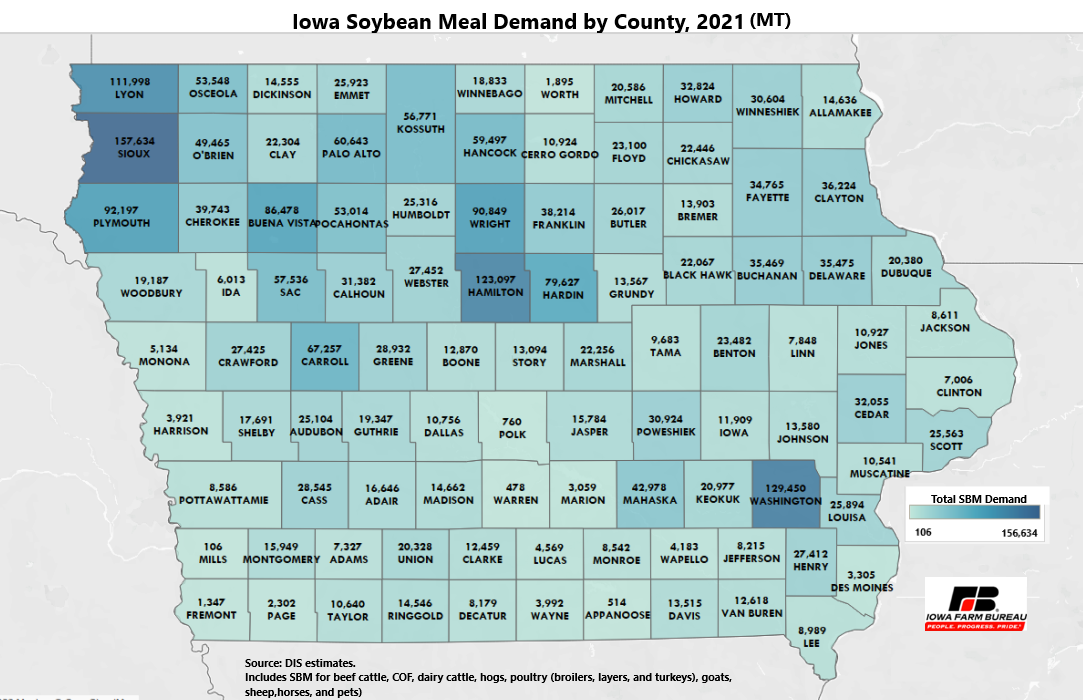
Figure 3. Iowa Soybean Meal Demand by County, 2021
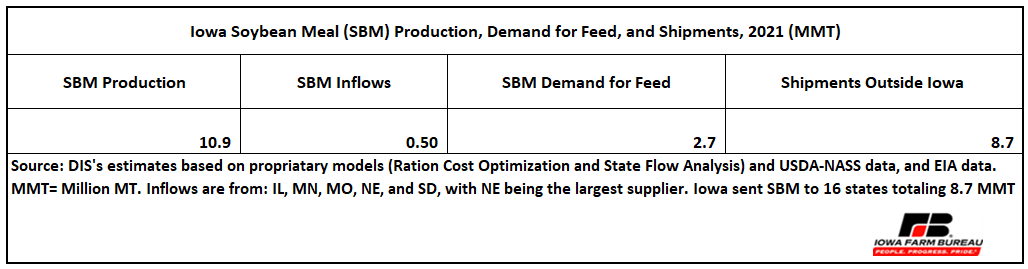
Considering Iowa production of SBM in 2021, the volume of SBM inflows into the state, and the volume of SBM demanded by the livestock and poultry industries in Iowa (2.7 million MT), Iowa‘s SBM shipments were assessed at 8.7 million MT in 2021.
Table 4. Iowa Soybean Meal Production, Demand for Feed, and Shipments, 2021 (MT)
Based on biodiesel production in Iowa across ten counties in 2021, Iowa demanded 1.3 million MT of soybean oil for biodiesel production (see Figure 4). The largest demand of soybean oil for biodiesel production was from two counties: Kossuth and Woodbury with 20.8% each of total soybean oil demand in the state for this biofuel.
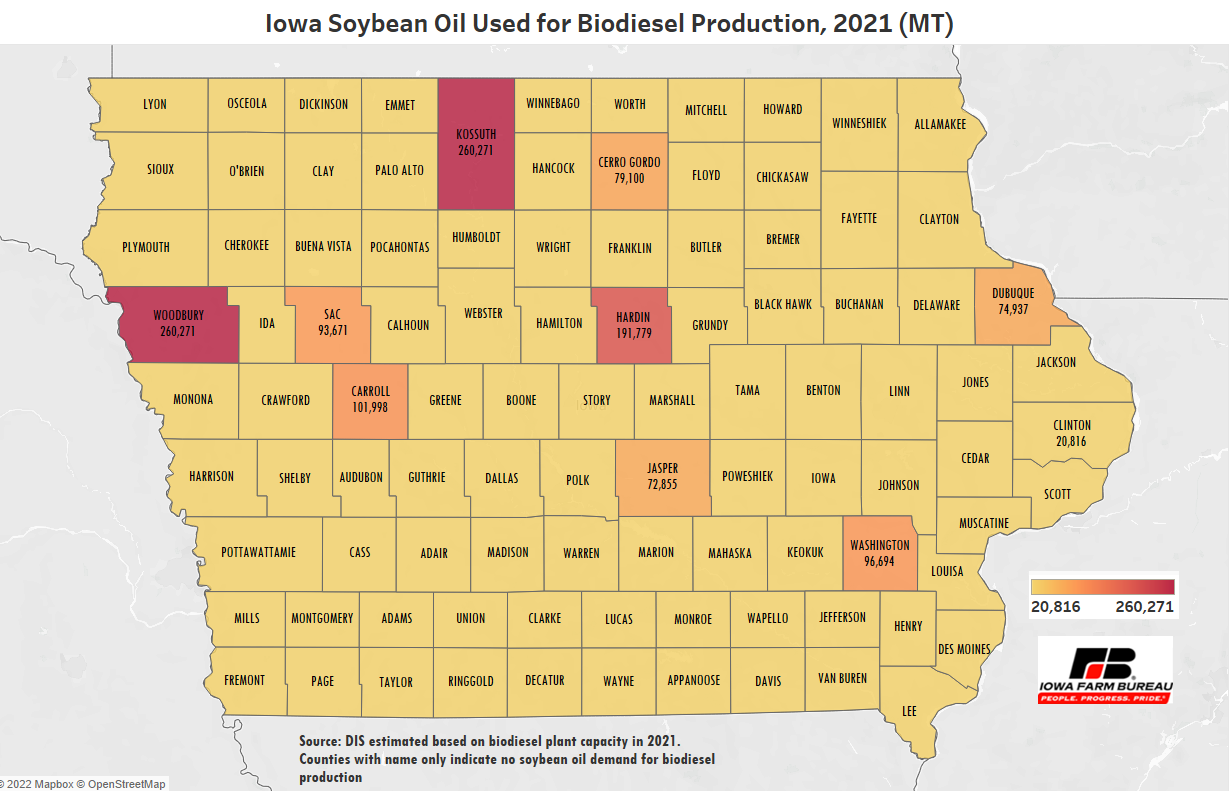
Figure 4. Iowa Soybean Oil Used for Biodiesel Production, 2021 (MT)
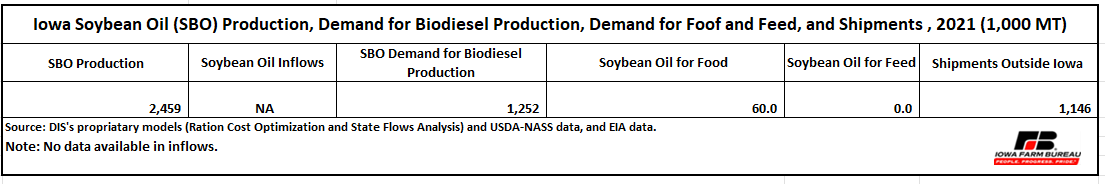
The total soybean oil production in Iowa in 2021 was estimated at 2.5 million MT of which 1.3 million MT were used by the biodiesel production in the state, leaving 1.1 million MT of soybean oil for shipments outside the state in 2021 (see Table 5).
Table 5. Iowa Soybean Oil Production, Demand for Biodiesel Production, Demand for Feed, and Shipments, 2021 (1,000 MT)
Economic analysis provided by Patricia Batres-Marquez, Senior Research Analyst, Decision Innovation Solutions on behalf of Iowa Farm Bureau.
Want more news on this topic? Farm Bureau members may subscribe for a free email news service, featuring the farm and rural topics that interest them most!