Financial Performance of Farming
Author
Published
2/22/2023
Introduction
Over the past two years real farm income reached levels not seen since 1972 (Figure 1). But as most in agriculture know, times are not always this good. Margins are typically not as strong as they have been over the last few years. USDA projects total farm income is expected to decrease in 2023, though this is an early projection and a lot can change between now and the end of the year.
In addition to having tight margins, farming is also a very capital-intensive business, with high value assets like land, machinery, and livestock. Total farm assets are also shown in Figure 1, along with total farm debt and equity that fund the assets.
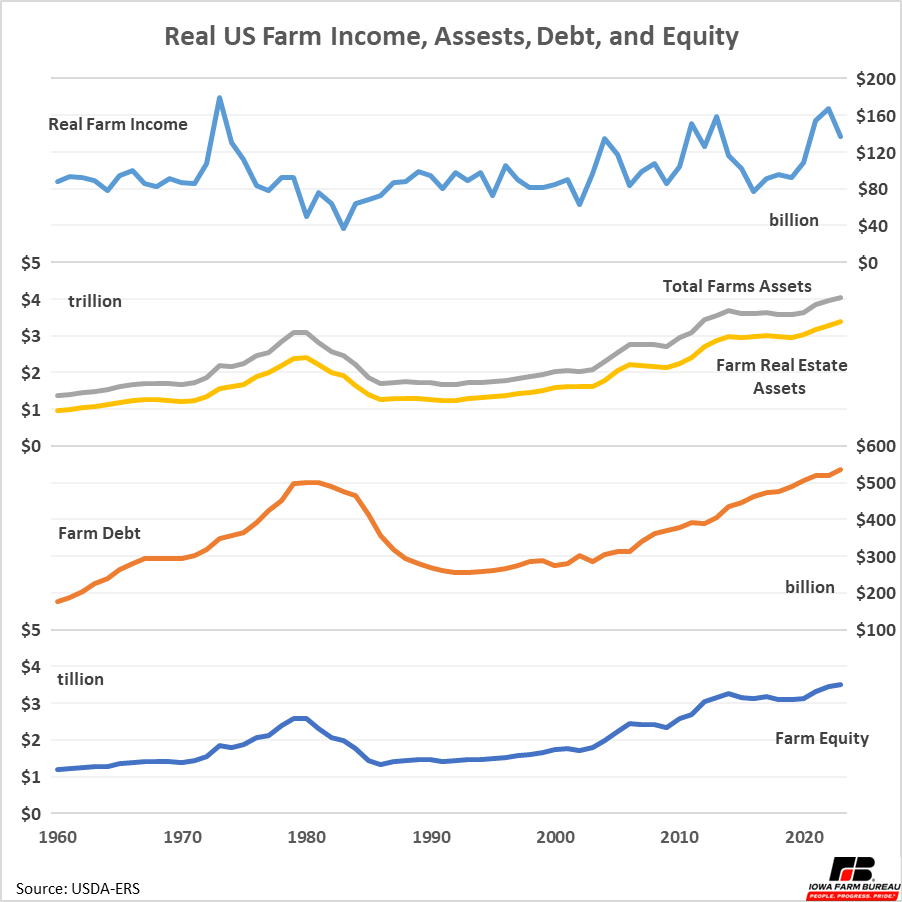
Figure 1. Real US Farm Income, Assets, Debt, and Equity
Farm Debt
One measure of the leverage in agriculture is the relationship of farm debt to farm assets. As shown in Figure 1 both the value of farm assets and farm debt have been rising. Figure 2 shows how these values have moved together. On average, farm debt rises by $118,400 for every $1 million rise in farm asset values.
While there is variation around this relationship, it shows that agriculture as a whole is not highly leveraged with regards to debt to asset ratios, although individual farmers (especially those that are cash renting and do not have a strong fixed asset base underpinning their operation) may be much more highly leveraged.
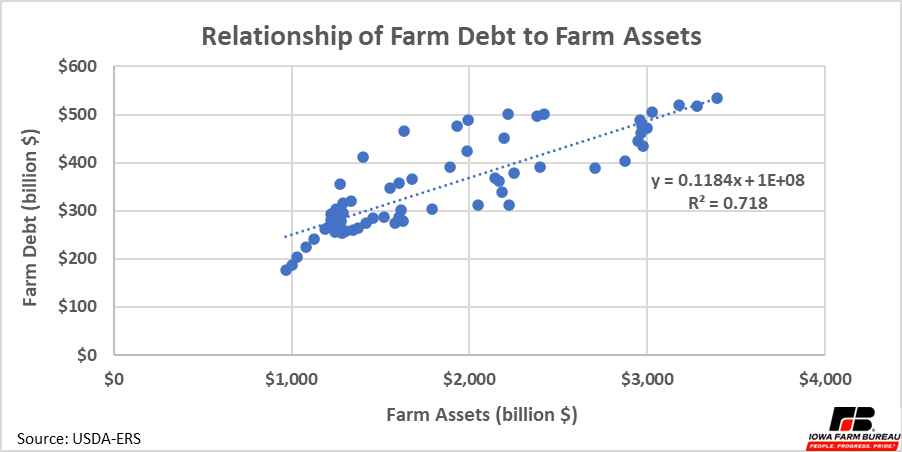
Figure 2. Relationship of Farm Debt to Farm Assets
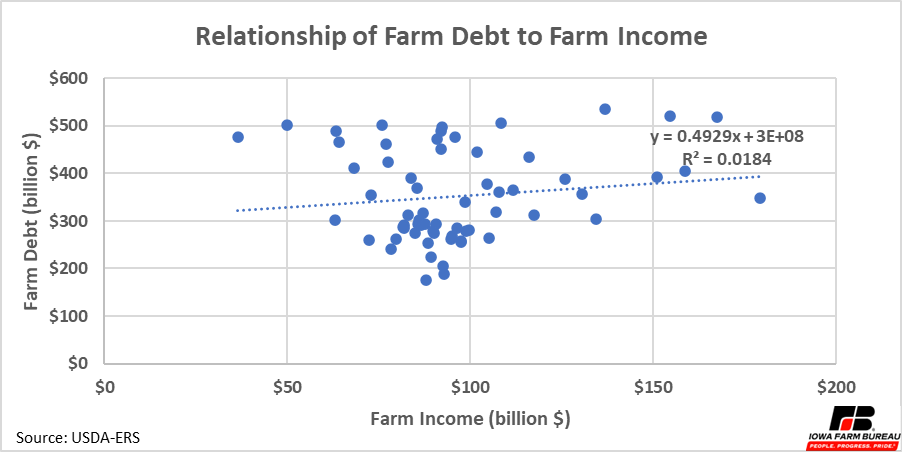
Figure 3. Relationship of Farm Debt to Farm Income
A challenge within agriculture, however, is that there is little relationship between net farm income and debt. The trendline in Figure 3 implies for every $1 net farm income rises, farm debt increases by 49.3 cents. However, the R-square of this relationship is near zero, meaning there is little correlation between income and debt.
There have been times when national net farm income was below $50 billion and farm debt was near $500 billion and times when net farm income is above $150 billion and farm debt was still around $500 billion. Clearly, it is easier to service the debt when net farm income is above $150 billion than when it is below $50 billion.
Returns to Farming
To understand the relative financial performance of farming, returns to farm equity can be compared to US stock market returns. Returns to farm equity shows the return on capital investment in farming. Equity growth occurs after payments for labor have been accounted for and provides an overview of how profitable the business and does not include the wages or salaries paid to workers or compensation for labor taken by the operating farmer.
A comparison of real growth in farm equity to real growth in the stock market is shown in Figure 4. Since 1960, annual growth in farm equity has averaged 1.7%, while stock market returns have been much higher at 6.7%.
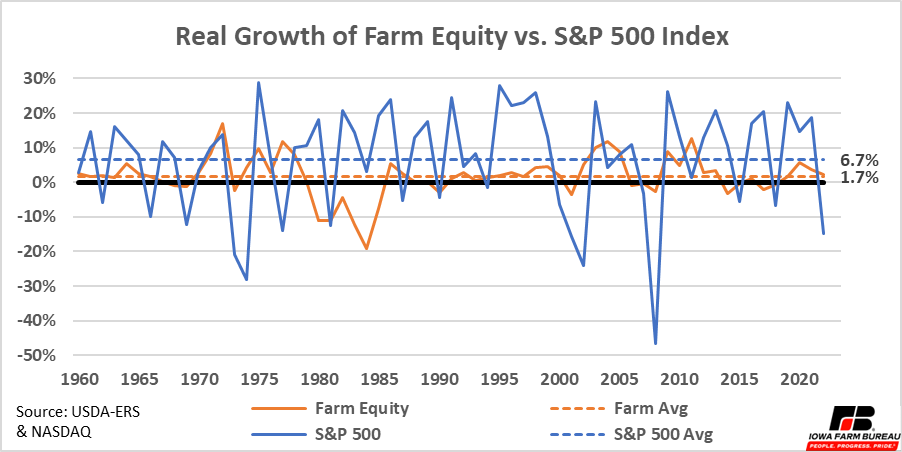
Figure 4. Real Growth of Farm Equity vs. S&P 500 Index
The fact that average returns to stock market equity are higher than returns to farming is not that surprising considering the maturity of both markets and the relative risk underlying ownership of assets in both markets (land in agriculture and stocks as aggregated in the S&P 500).
Agriculture is a very mature market. There are many established farmers across the US who compete with one another all using relatively similar production methods. Furthermore, the agricultural land in the U.S has been fully developed for more than a century. While technological advancements are may make land more productive, large increases in the quantity of agricultural land is not occurring.
On the other hand, The S&P 500 contains companies operating in industries that are younger and growing faster than agriculture. For example, Apple, Meta (Facebook), Alphabet (Google), and Amazon did not even exist 30 years ago. The development of new technology as well as the growth of economic activity associated with that new technology make the assets of the S&P 500 much less mature than those employed in agriculture. Mature markets are expected to be very competitive and generally have lower returns than newer, faster growing markets.
While farming does have lower returns, it also has less risk. The variance of stock market growth is over six times larger than farm equity growth. The stock market experiences years of large declines and years of large increases, and these movements are much larger in both directions than changes in farm equity. Interestingly, the returns of both markets are not highly correlated, meaning years of high stock market returns are not closely associated with years of high farming returns and visa versa (Figure 5).
As shown in Figure 5, the green dots represent times when farm returns were greater returns from the S&P 500 and the red dots indicate times when returns from the S&P 500 were greater than farm equity returns. The maximum returns in any one year for national farm equity has been 16.8% whereas the maximum returns from the S&P 500 in any one year have been 28.9%. However, the minimum annual loss for farm equity was a decline of 19.2% whereas the minimum annual loss for the S&P 500 was 46.6%.
The oval in Figure 5 represents 2 standard deviations from mean returns of both farm equity (1.7%) and the S&P 500 (6.7%). The sum of total absolute negative deviations (TAND) was also calculated for both series of returns. The TAND for agricultural returns is -82.2% whereas the TAND for the S&P 500 is -238%. This means that the downside risk of owning agricultural assets is about one-third of that of owning the assets of the S&P 500 index. Yes, there is greater upside with the S&P 500, but also much greater downside year-to year.
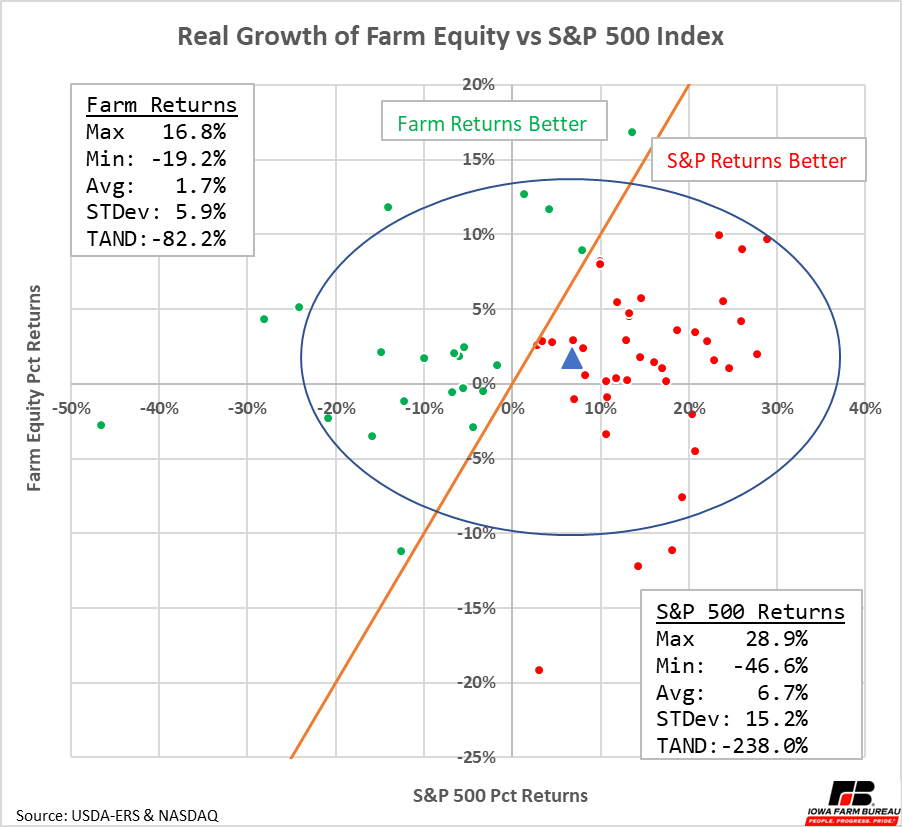
Figure 5. Farm Equity Growth vs S&P 500 Returns
Growth in farm equity can also come from appreciation of farm assets, like farmland, in addition to profit retained and reinvested by a farm. Looking back at Figure 1, we can see the value of total farm real estate assets. The average annual growth in real estate farmland assets since 1960 has been 2.0%. Total farm real estate assets also include things like buildings and other infrastructure which is built and then depreciates. For simplicity let’s assume it contains primarily farmland as the 2.0% annual growth rate is pretty close to what farmland values have historically experienced.
Farm equity can increase through profits that are reinvented into the farming business or by appreciation of held assets. Assuming all farm real estate assets are farmland that appreciates, means almost all the growth in farm equity could be attributed to growth in farmland values. While somewhat surprising, this again points to a mature market. Over many years, markets develop to a point where profits over the long term are equal to zero. After accounting for growth in farmland value, growth in farm equity appears to be near zero in the long run.
This is not necessarily a bad thing. Labor, even labor of the farmers running their own farm, is accounted for before return to equity is calculated, so, farmers are still earning money. Furthermore, the farm equity data used here represented an estimate of all US farming. Operations that are more efficient would have positive returns while operations that are less efficient could be seeing negative returns. Finally, developed markets typically offer the best value to consumers as years of competition forces the market, in this case agriculture, to offer the highest quality product at the market-competitive prices.
Economic analysis provided by David Miller, Consulting Chief Economist, and Aaron Gerdts, Research Analyst, Decision Innovation Solutions on behalf of Iowa Farm Bureau.
Want more news on this topic? Farm Bureau members may subscribe for a free email news service, featuring the farm and rural topics that interest them most!