Diesel Fuel Update: Stocks are Low, Prices Remain High
Author
Published
11/3/2022
Introduction Diesel prices have seen large, persistent price increases over the past two years. For example, from this time last year, gasoline prices are up 12%, but diesel prices are up 44%. One reason often cited is low diesel fuel stocks. This article outlines current diesel fuel stocks, production and consumption, and prices.
U.S. Diesel Stocks
U.S. diesel stocks are lower than they have been in recent years. Figure 1 shows weekly U.S. distillate fuel oil stocks measured in days of supply. Most distillate fuel oil is used for low sulfur diesel fuel. Days of supply is a common measure used to make inventory relative to domestic consumption. For example, the spike in 2020 is relatively large because distillate fuel oil stocks increased but consumption also decreased, making the spike look even larger.
Days of diesel supply dipped as low 25 days earlier in October but has since moved back up to around 27 days. Stocks remain on the low side and are near the low side of stocks in 2008, 2014, and 2019. Although recently stocks have remained at these low levels longer than they have in the past.
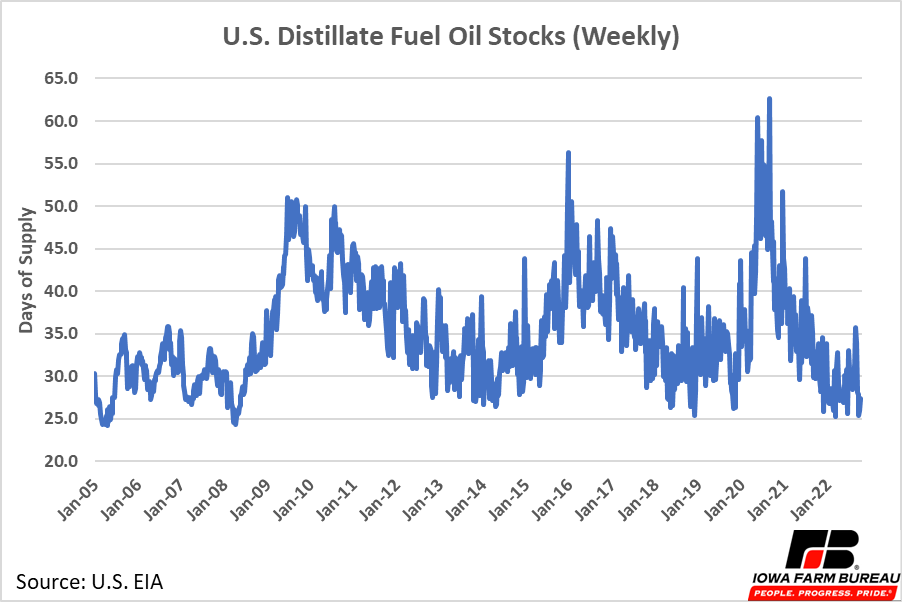
Figure 1. U.S. Distillate Fuel Stocks (Weekly)
Regionally, there are areas dealing with tighter supplies than others. Figure 2 shows U.S. diesel stocks for the whole country and each individual PADD region reported by the EIA. Here stocks are simply reported in barrels, not days of supply. A map of the PADD regions is provided in Figure 3.
Regionally, PADD 1 has faced the tightest supply of diesel fuel with stocks below its 5-year range for the whole year. PADD 2, which includes Iowa, had stocks dip below its 5-year range in May. PADD 2, like most regions of the U.S., typically builds up inventory over the summer, and then sees inventory decline in the fall and winter. Diesel stocks in the Midwest did not build up as high as they typically do this summer, but also did not see as large of a fall decline. It is not yet clear whether PADD 2 inventories will continue to decline further below the 5-year range as we move into the winter, or if PADD 2 simply operates on available production this year.
While other PADD’s are on the low end of their inventories, they all sit within their 5-year ranges. The East Coast, and to a lesser extent the Midwest, are the two areas of the country that have been most effected by reduced U.S. diesel stocks.
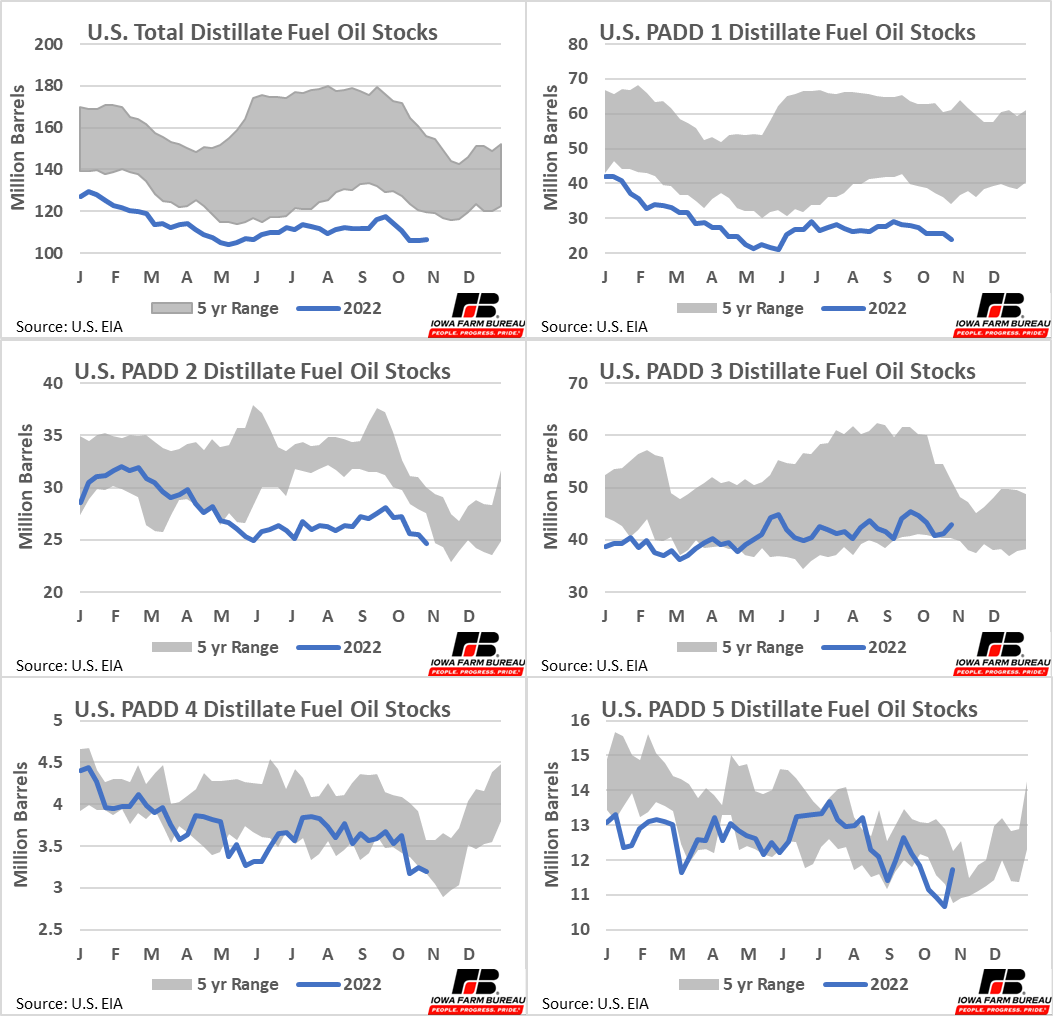
Figure 2. U.S. Distillate Fuel Stocks by PADD Region
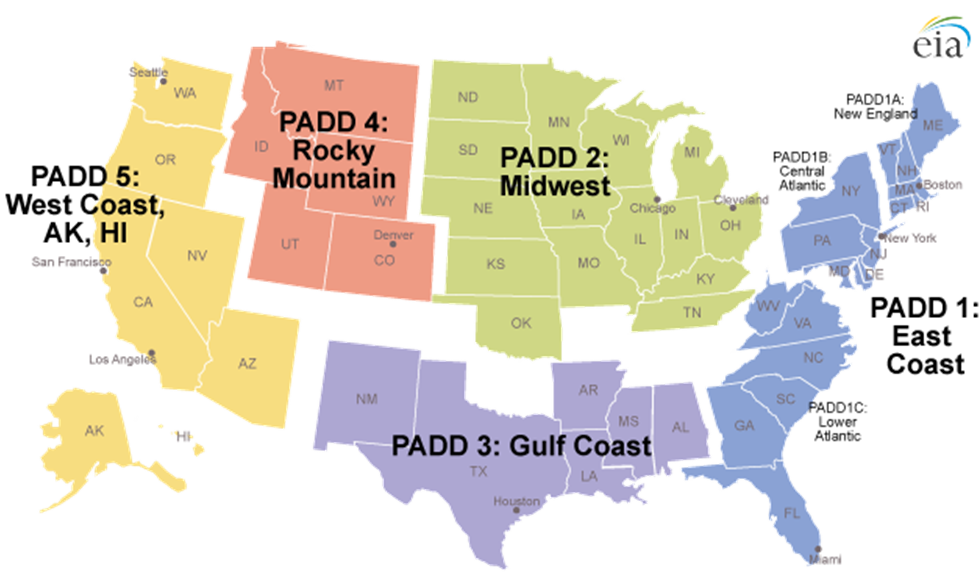
Figure 3. U.S. EIA PADD Regions
Page Break
Why Stocks are Down
A combination of a slow return of pre-pandemic production and quick return of pre-pandemic demand led to reduced diesel stocks.
Production of diesel fuel from crude oil slowed following the pandemic. Both total capacity and utilization fell during and after the pandemic. In January 2020, the U.S. had almost 19 million barrel per day processing capacity. Today it is below 18 million barrels per day. Furthermore, utilization rates decreased in 2020 and 2021. Capacity utilization typically ran between 85% and 95% pre-pandemic, but in 2020, and the early part of 2021, utilization ran between 70% and 80%. The pandemic-induced disruptions to supply chains and now rapid inflation are contributing factors to these reduced utilization rates.
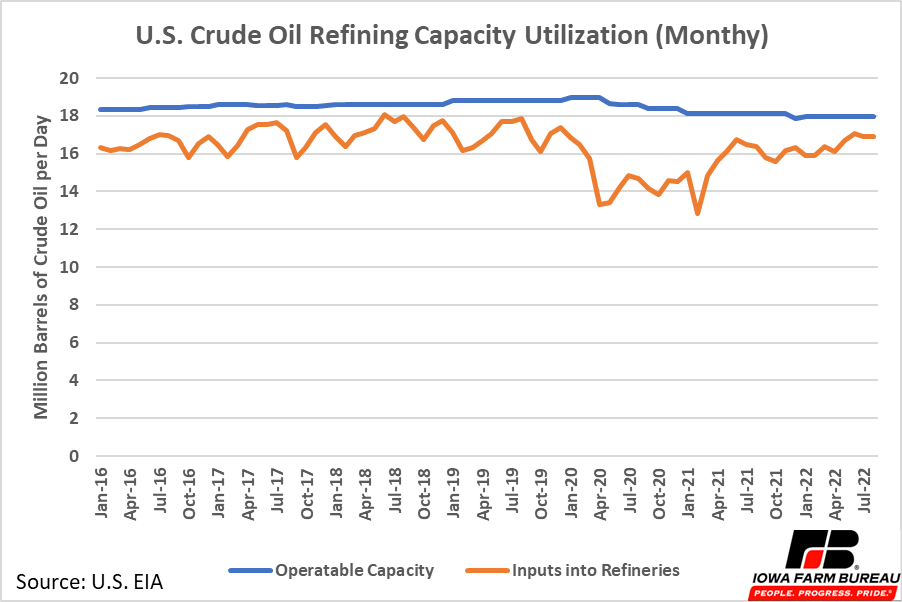
Figure 4. U.S. Crude Oil Refining Capacity Utilization (Monthly)
Page Break
Reduced production would not be a big deal if consumption was also lower. However, demand for diesel returned to the market much faster than production. Consumption outpaced production in 2021 and 2022 reducing U.S. diesel stocks.
Figure 5 shows diesel production and consumption. Shaded in gray is the time during 2020 and 2021 when refineries were operating at lower utilization rates. At the start of the pandemic, reduced production was adequate as consumption fell drastically during the lockdown. However, consumption rapidly increased in June 2020 and continued to increase past production levels during the latter months of 2020. While production eventually rebounded in 2021 and 2022, demand was so strong that consumption exceeded production in both 2021 and 2022 quickly eating into stocks built up at the beginning of the pandemic.
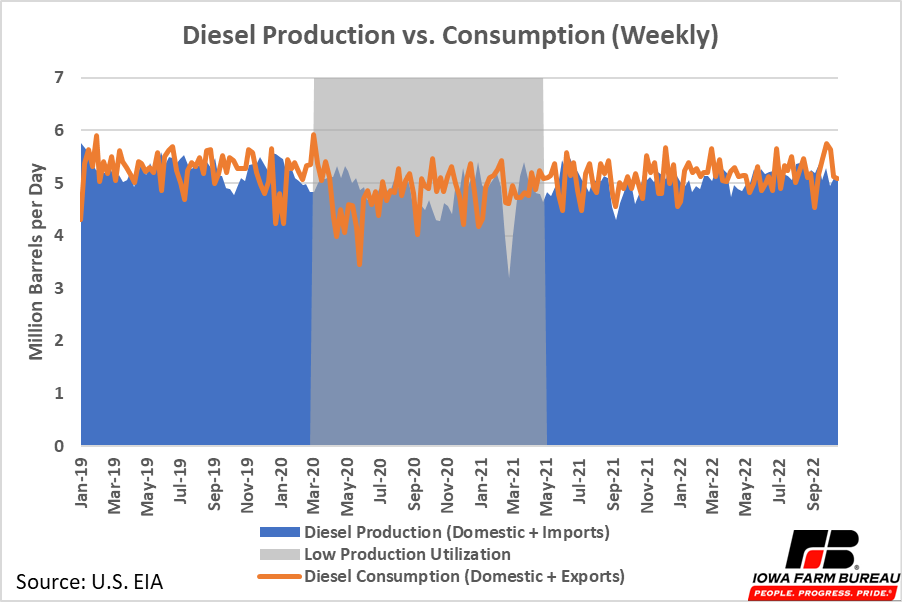
Figure 5. Diesel Production vs. Consumption (Weekly)
In addition to the reduced domestic production, the Russian invasion of Ukraine has not helped matters. Many countries banned Russia energy imports after the invasion and turned to other countries to meet their energy needs. The U.S. has been one of those counties. The U.S. is a net exporter of diesel fuel and exports of diesel have grown following the Russia invasion as demand from other countries of U.S. diesel grew (Figure 6).
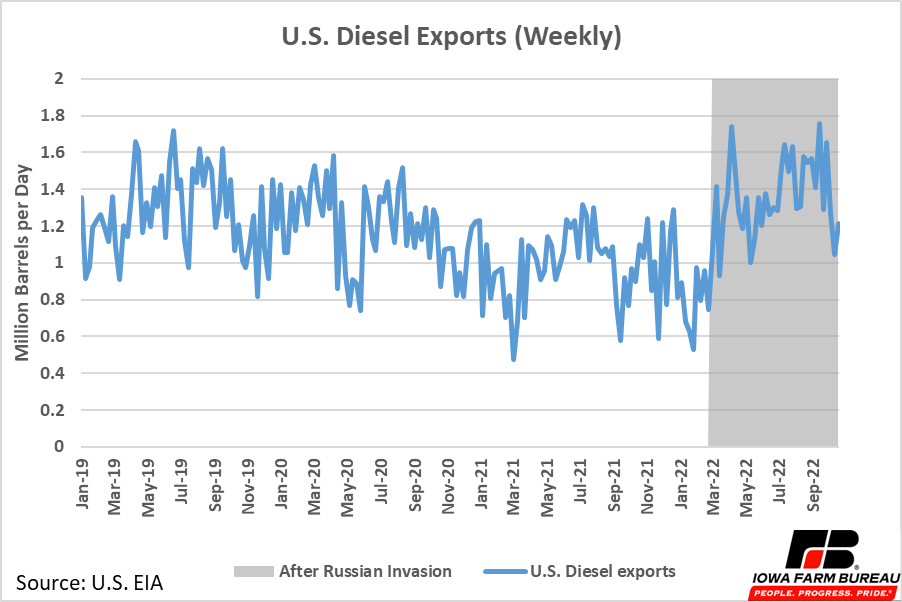
Figure 6. U.S. Diesel Exports (Weekly)
Page Break
Prices
As mentioned in the introduction, diesel fuel prices have seen larger, more persistent price increases than gasoline. Figure 7 shows the weekly prices of both fuels since early 2019. Diesel prices have not come down as much as gasoline prices over the last 4 months, and the spread between the two fuels has increased significantly compared to the previous three years.
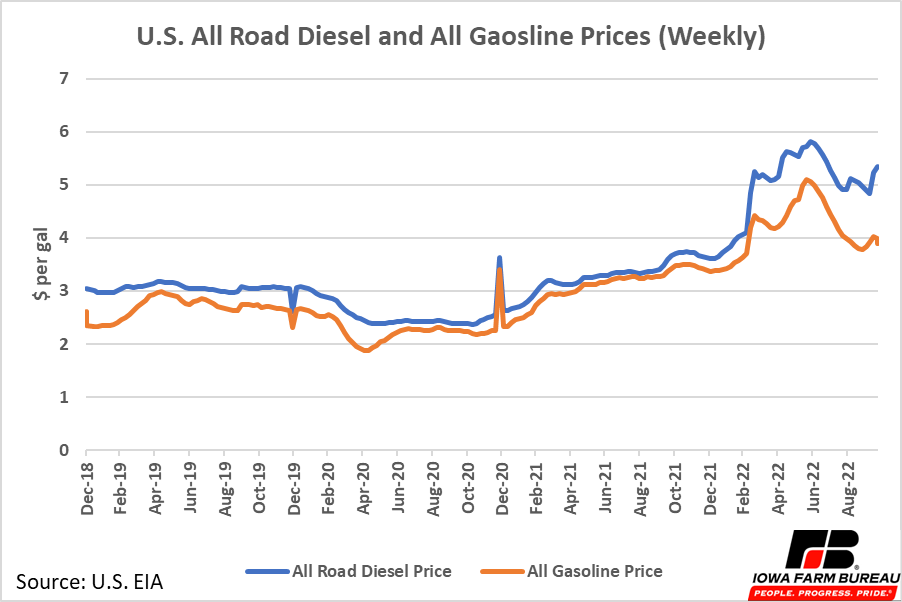
Figure 7. U.S. All Road Diesel and All Gasoline Prices (Weekly)
Page Break
In the Midwest, it appears the tightening of diesel stocks in PADD 2 has led to relatively higher prices. Figure 8 shows weekly diesel prices in PADD 2 and the U.S. in 2022. To start the year prices in PADD 2 sat around $0.10 per gallon below the U.S. average. This gap held throughout the first six months of the year, at times getting as high as $0.20 per gallon. PADD 2 stocks began tightening in June and by the middle of June the gap between the PADD 2 price the U.S. price was gone. Occasionally, this fall the PADD 2 price exceeded the U.S. average.
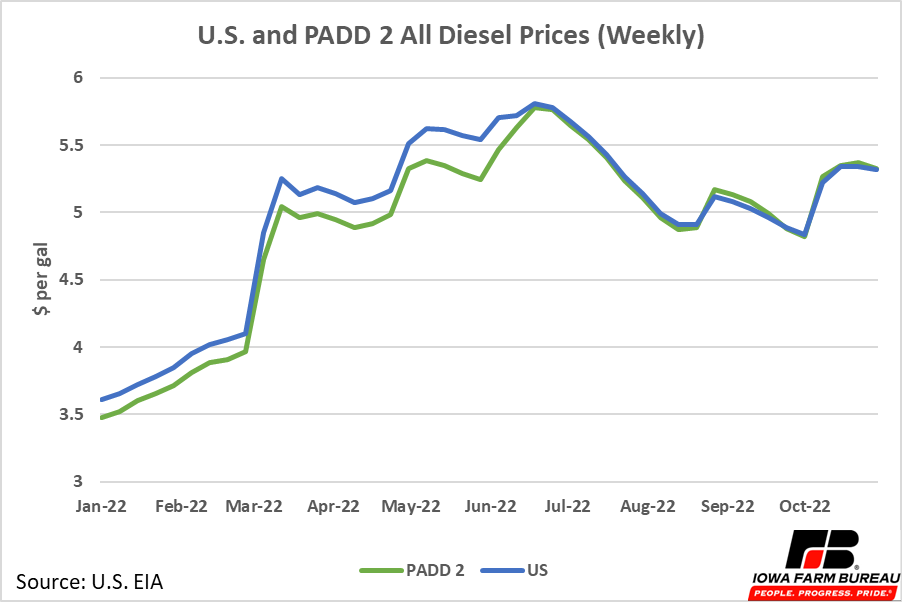
Figure 8. U.S. and PADD 2 All Diesel Prices (Weekly)
Conclusion
U.S. diesel stocks have been on the low end of the normal historical range since the beginning of 2022 and remain low now. However, some regions are feeling the effects more than others. The East Coast has the biggest diesel fuel shortage, followed by the Midwest, with all other PADDs within historical ranges in terms of current inventory.
U.S refinery capacity was limited in 2020 and the early part of 2021. This combined with a relatively quick return of demand for diesel fuel, reduced U.S. distillate fuel stocks.
In 2021, U.S. refinery capacity returned to a more normal utilization rates, but with less total available capacity. Utilization rates have continued to climb recently, reaching over 94% from June 2022 to August 2022, the three most recently reported months.
U.S. diesel prices remain high and have not shown signs of coming down soon. Prices here in the Midwest have increased relative to other areas of the country in the second half 2022, due to reduced supplies.
With refineries operating near realistic capacity and stocks not yet showing signs of improvement, stocks are expected to remain low, with prices likely remaining high in the short term.
Economic analysis provided by Aaron Gerdts, Research Analyst, Decision Innovation Solutions on behalf of Iowa Farm Bureau.
Want more news on this topic? Farm Bureau members may subscribe for a free email news service, featuring the farm and rural topics that interest them most!