Corn Yields in the Midwest in 2019: USDA Report Shows Better Yields than Expected
Author
Published
8/20/2019
The latest USDA report shocked the trade with yield estimates that were significantly better than expected given the very delayed plantings that occurred across much of the Midwest in 2019. Pre-report expectations assumed that corn yield in states like Indiana and Illinois would be significantly below trendline given the record late plantings. But that was not the case. So how did the August USDA yield estimates stack up against historical yields and pre-report expectations?
Iowa
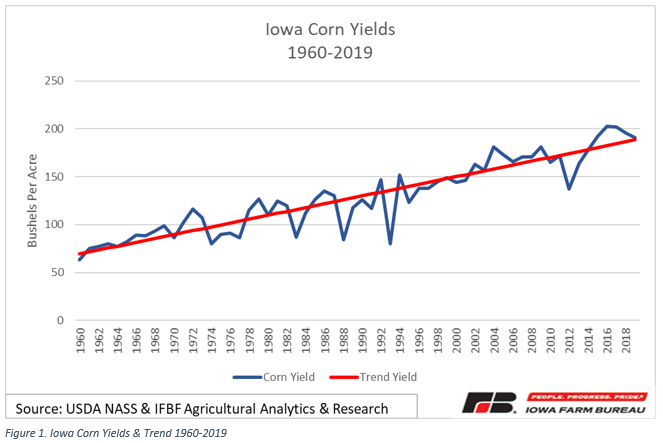
Pre-report windshield estimates suggested that Iowa corn yield would likely be in the mid-180s, or slightly below trendline yield which is 188.5 bu/acre using 60 years of data from 1960 (See Figure 1). The August USDA yield estimate for Iowa of 191 bu/acre is 1.3% above trendline yield.
In our pre-report analysis, we estimated the Iowa corn yield at 184.7 bu/acre which is 3.8 bu/acre less than trend yield. Figure 2 shows how the USDA yield or 191 compares to our pre-report estimate and to historical yields since 1960. So, how does a 1.3% above trendline yield stack up for Iowa corn yield prospects. USDA’s yield estimate for Iowa of 191 bu/acre is 2.5 bu/acre greater than trend line.
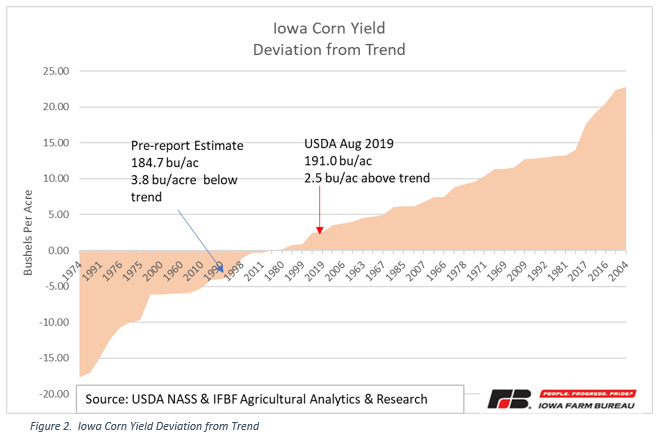
Figure 2 shows deviations from trend yields for Iowa corn. As can be noted from the charts, there have been more above-trend yields (58.3% of the time) than below-trend yields over this 60-year period. In fact, the mid-point of 60-year expectations is for yield to be 2.5 bu/ac greater than trend yield. So, USDA’s August report would fall right at the 50% mark of all yields from the past 60 years for “deviation from trend” on a bushel-per-acre basis.
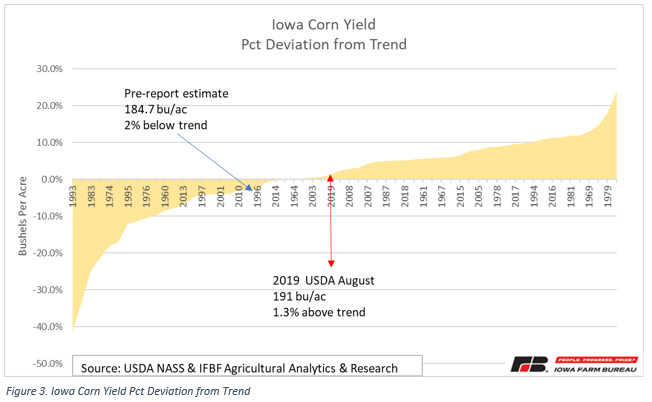
Figure 3 shows the percentage deviation from trend yield. The 191 bu/ac yield estimate for Iowa is 1.3% greater than trend yield with the 60-year trend yield for Iowa for 2019 being 188.5 bu/acre). This was 3.3% greater than the prior expectation and stands at the 48.3 percentile of yield deviations since 1960. Over the past 60 years, there have been 29 times that the percent yield deviation from trendline has been 1.3% or less. To put further perspective on this, 15 of the past 60 years (25% of the time) Iowa corn yields have been between -3.1% and +3.1%.
Illinois
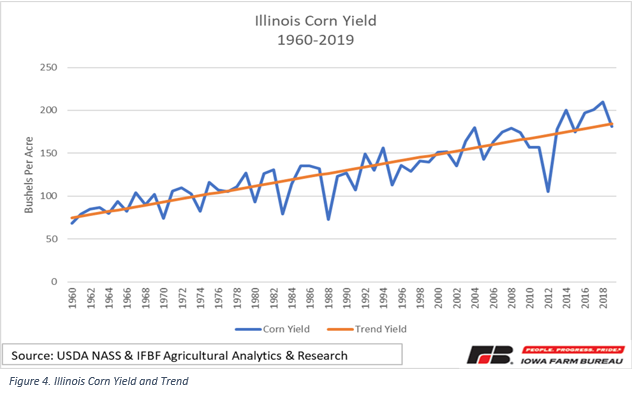
Illinois trend yield for 2019 is 184.1 bu/ac. (Figure 4.)
Illinois corn planting experienced more delays than Iowa corn planting. Only 20% of Iowa corn was planted after June 3rd, whereas 55% of Illinois corn was planted after June 3rd. The pre-report expectations were that planting that much of the Illinois crop after June 3rd would result in a significant negative deviation from trend yield. In our analysis prior to the USDA report, I used a 33.1 bu/ac (18% below trend) deviation from trend yield, or 151 bu/ac. This would have been in line with yield deviations in prior “late-planting” situations. In 1995, for example, the Illinois corn yield was 26.5 bu/ac below trend which was 19% below trend. In 1974, another very late planting year, Illinois corn yield was 18.6 bu/ac (or 18.6%) below trend yield. Figure 5 shows the deviation from trend for Illinois corn yields since 1960.
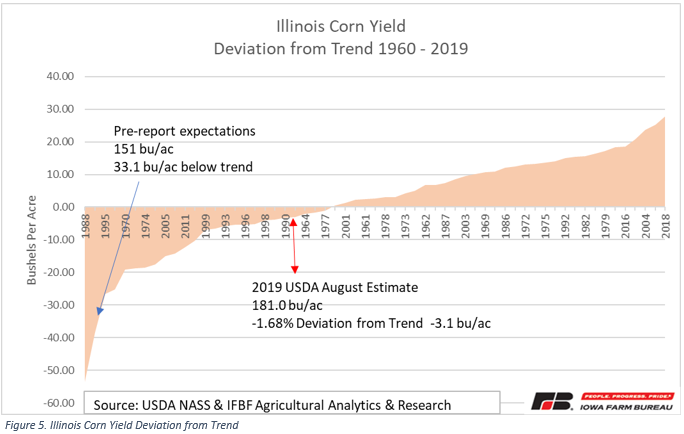
The USDA August estimate of 181 bu/acre is 3.1 bu/acre below trend. A 181 bu/acre yield in Illinois is at the 38th percentile meaning that over the past 60 years, 22 times the yield has been seen a greater negative deviation from trend, and 37 times, the Illinois yield has seen a better deviation from trend yield. A “normal” or 50th percentile yield for Illinois would be 3.3% above trendline. This year’s August estimate of 1.7% below trend yield is at the 38th percentile of yields over the past 60 years.
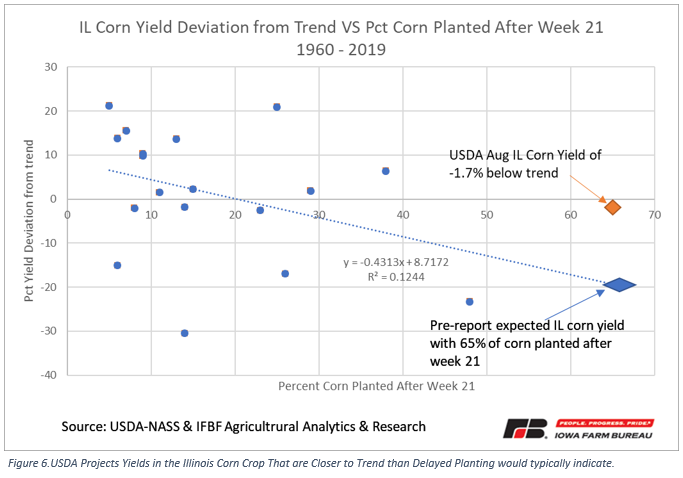
The USDA August yield estimate was likely the largest “surprise” from pre-report expectations that has ever occurred. In the central Corn Belt, estimated yield loss per day with delayed planting varies from about 0.3% per day early in May to about 1% per day by the end of May, according to Bob Nielsen at Purdue University. Illinois had 65% of its corn planted after week 21 (May 26th). In the only prior year with close to 50% of corn planted after week 21, the Illinois corn yield was more than 20% below trend yield.
Indiana
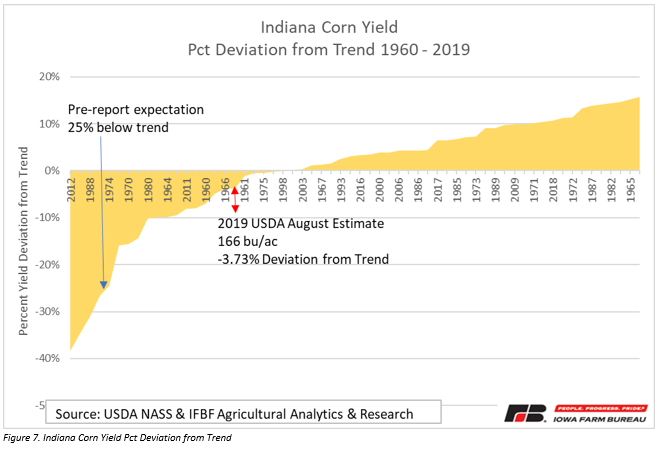
Indiana corn yields might have provided the greatest surprise from pre-report expectations. USDA’s August estimate of 166 bu/acre is just 6.44 bu/acre below trend yield, or 3.73% below trend. Pre-report expectations were for a yield that would be 25% below trend, or 129.3 bu/ac. Indiana only had 22% of its corn planted by week 21, or in other words, 78% of its corn planted when yield reductions of at least 1% per day of delay were expected. Instead of expectations for the 2nd greatest deviation from trend yield over the past 60 years, Indiana’s 166 bu/acre yield is at the 26th percentile, or not even in the worst ¼ of yields on a relative basis.
U.S. Corn
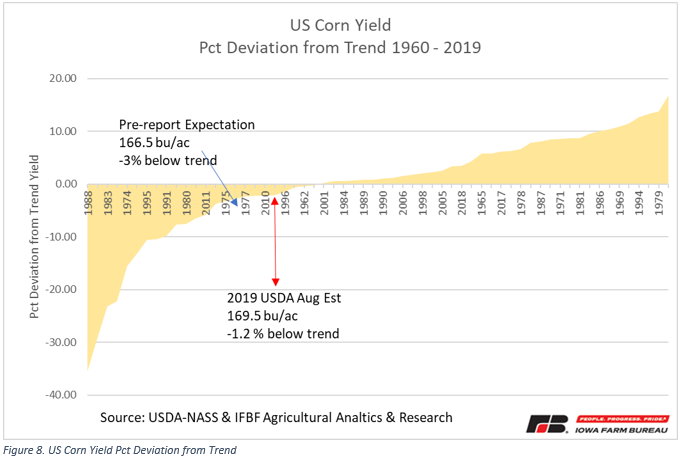
For the U.S. as a whole, 2019 was a year with the most delayed corn planting on record. One-third of the corn crop was planted after Jun 3rd. Weather has been overall favorable toward corn development since planting, and that has resulted in an August USDA yield estimate of 169.5 bu/acre. This is just 2.13 bu/acre below the 60-year trendline which is 1.2% below trend yield. The question a lot of producers are asking is “how could a 2% yield increase result in a 50+ cent (13%) decline in corn prices. Given a normal price flexibility, a 2% yield increase would normally be associated with a 4 to 6% price decline. But this time was different.
What was different? For one, the USDA acreage re-survey resulted in significantly more planted corn acres than the trade was expecting. USDA reported 90 million acres of corn were planted. The trade was expecting about 87 to 88 million acres with some estimates well below these levels. Yield was increased 3 bu/ac when the trade was expecting a slight yield reduction. All together this resulted in a 700 million bushel “miss” on production estimate of 13.9 billion bushels versus expectations for 13.2 billion bushels of production. Combine this with a deteriorating demand situation and the net result was an increase in 2019-20 ending stocks of 171 million bushels when the trade was expecting ending stocks of 1.605 billion bushels. This was a “upward surprise” of 35.8% in projected ending stocks. Given normal historical relationships, the reaction of the markets to this shock was not out of line and could still reflect significant uncertainty regarding the level of yields that will actually be harvested.
Conclusion
While corn planting was delayed across much of the U.S. this year, the delays in eastern cornbelt states were most pronounced. While these delays in plantings were expected to set in place the environment for very low yields in states like Indiana, Michigan and Ohio, that was not confirmed by the August USDA crop report. While yields in the eastern cornbelt are still estimated below trend, they are significantly better than early market expectations. The post-report price reactions have been in line with historical relationships based on changes in projected ending stocks versus pre-report expectations. What remains to be seen is what actual production is this year. We probably will not know for certain until the combines begin to roll across the cornbelt.
Want more news on this topic? Farm Bureau members may subscribe for a free email news service, featuring the farm and rural topics that interest them most!