Corn Verses Soybean Profitability
Author
Published
8/8/2018
The data that this article is based on prices received by Iowa farmers and average total costs of production incurred by Iowa farmers. This data is from Iowa State University’s Ag Decision Maker and from the USDA’s national agricultural statistics service. Using these data points and graphing them over time corn seems to have a less volatility over time, what this means is smaller troughs and peaks in profitability. In the last decade both corn and soybeans seem to have become proportionally more volatile. See the graph below.
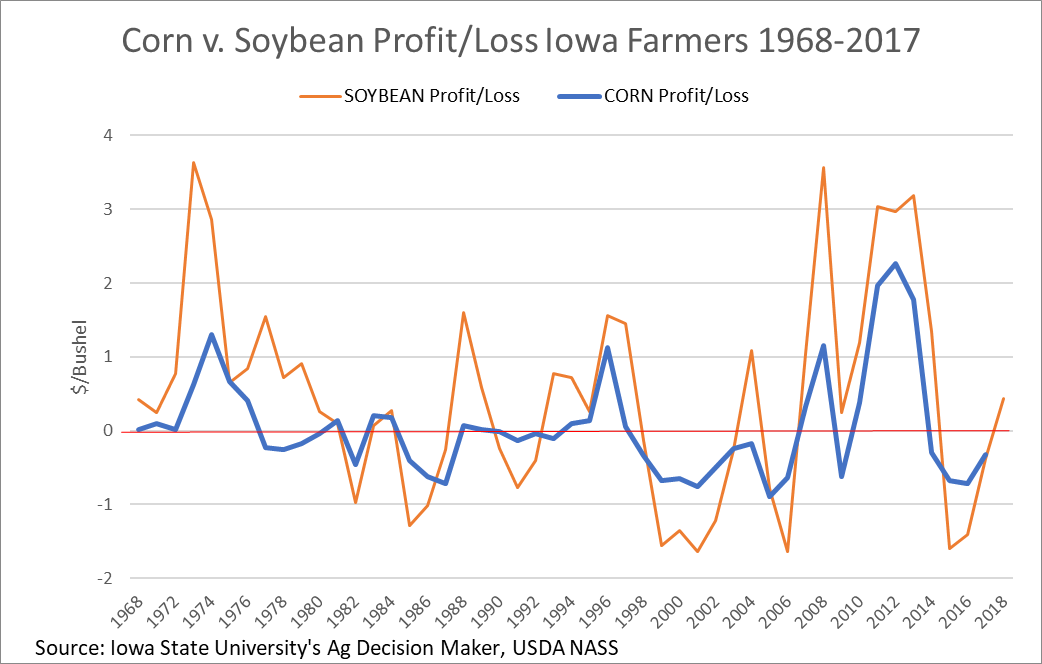
Although this graph shows real historical profits from a simple price verses cost comparison, what is not represented here are the government payments or other value-added profits on each farm. However, it does provide insight that can inform strategy discussions for farmers.
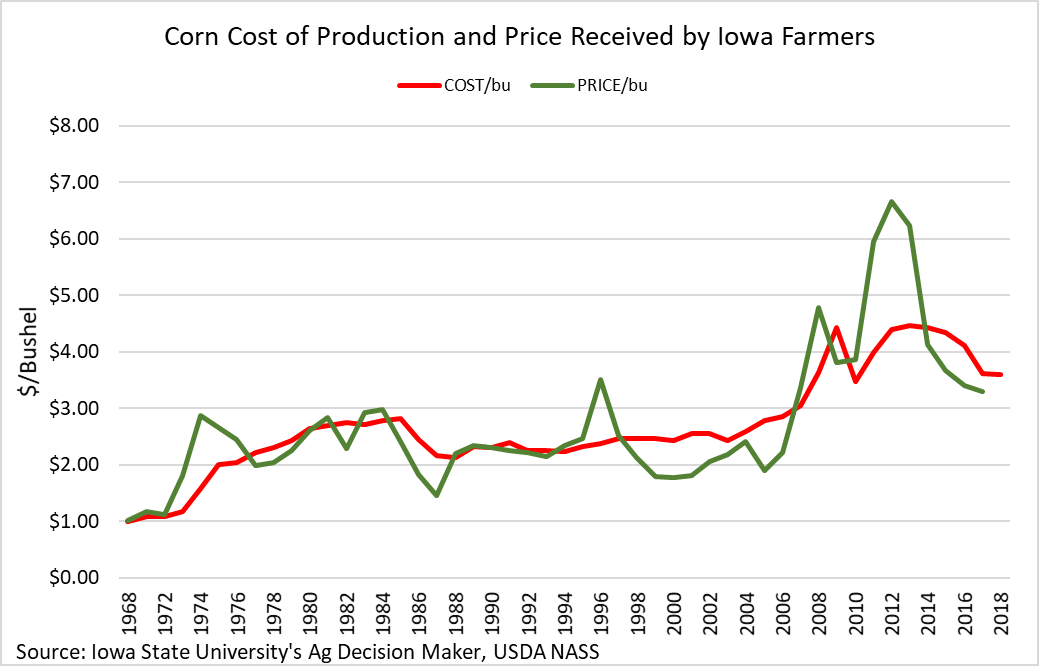
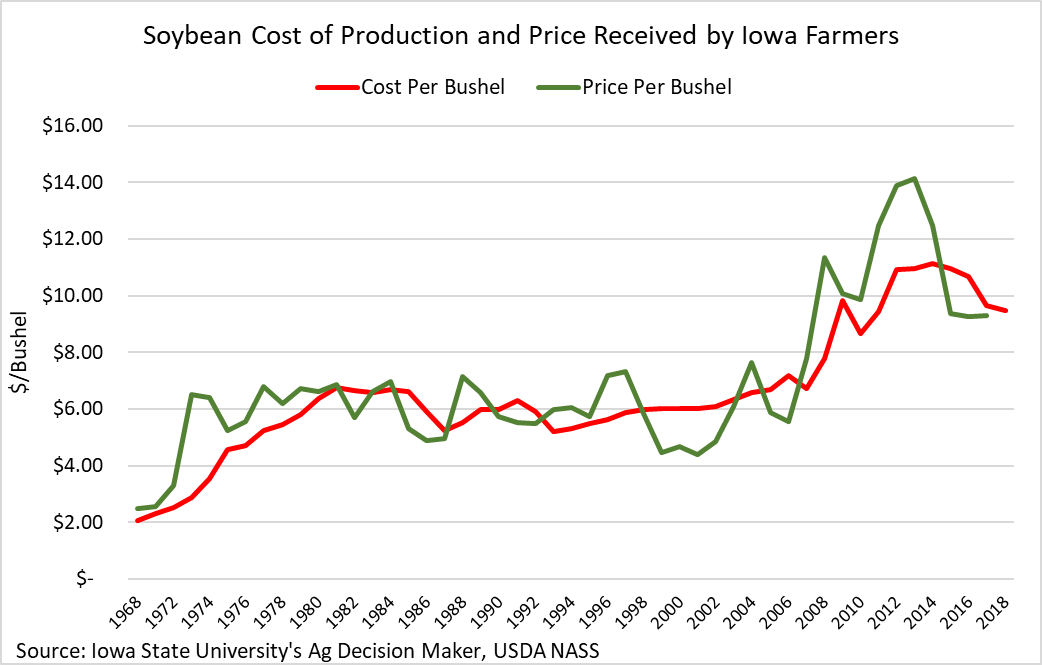
Below are additional graphs showing the individual cost vs price trends from 1968 to 2017. With soybeans competing more so on the international market there are more significant fluctuations. Corn as mentioned previously is less volatile, in part, due to more domestic utilization.
Want more news on this topic? Farm Bureau members may subscribe for a free email news service, featuring the farm and rural topics that interest them most!