A Deeper Look at Food Inflation
Author
Published
11/4/2022
Inflation in the U.S. has hit almost all major products including food. Figure 1 shows the monthly CPI for food and all products since 2000. The CPI-Food index has increased much faster over the past two years than in the previous 20 years. Food inflation was 1% over the last month, 11% over the last year, and 16% over the last two years. In comparison, the CPI for all items was flat last month, up 8% for the past year, and up 14% over the past two years. From 2000 through 2009, food inflation lagged the inflation rate for all items. Since 2012, food inflation has tended to be stronger than the inflation rate for all items.
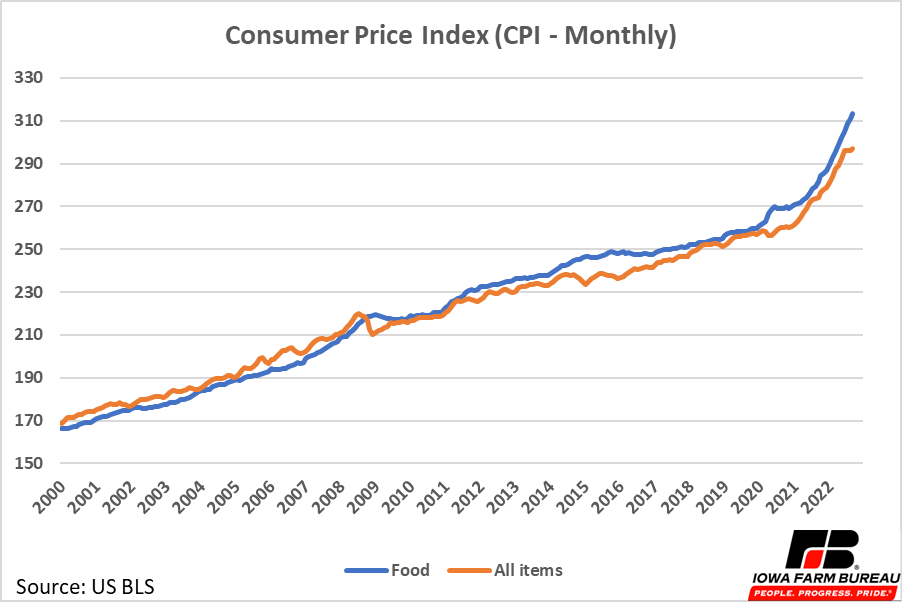
Figure 1. Food CPI (Monthly)
These are the aggregate numbers for all food we hear reported often. To arrive at these numbers, the Bureau of Labor Statistics looks at a wide variety of common food products. Some food products have increased in price more than others. The attached figures provide a deeper dive into how much prices of major retail food products have changed over the past month, year, and two years.
Figure 2 shows changes in major retail food items from August 2022 to September 2022. Lettuce, and fats including margarine and salad dressings have increased the most over the last month. On the other hand, eggs and ground beef have come down in price more than the other listed products. For eggs, this may mean some of the challenges HPAI presented may be beginning to be worked through. Though the fall bird migratory season could present challenges from the disease again this fall as a new case of HPAI was reported in Wright County, Iowa during the first week of November.
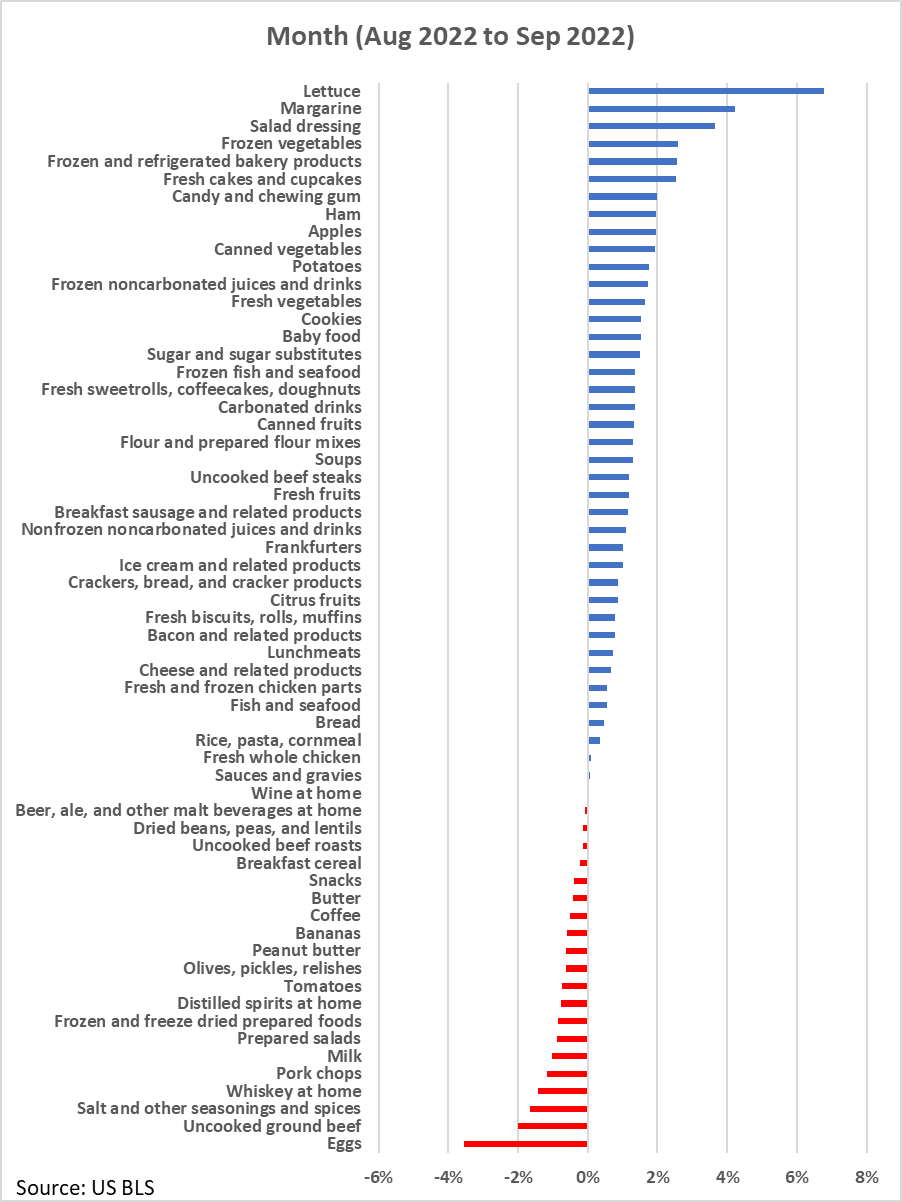
Figure 2. Monthly Inflation (Aug 2022 to Sep 2022)
Figure 3 shows changes in major retail food items from September 2021 to September 2022. Fats, this time margarine, and butter also top the list of year-over-year inflation. These products have continued to increase in price and are showing some of the largest inflation numbers of all retail food items. Only a few products, beef, and tomatoes, decreased in price during the past year. Both have increased in price over the past month more than other products but remain below year-ago levels. As mentioned earlier, egg supplies have been affected by HPAI, in addition to facing inflation, which lead to a large increase in price over the last year.
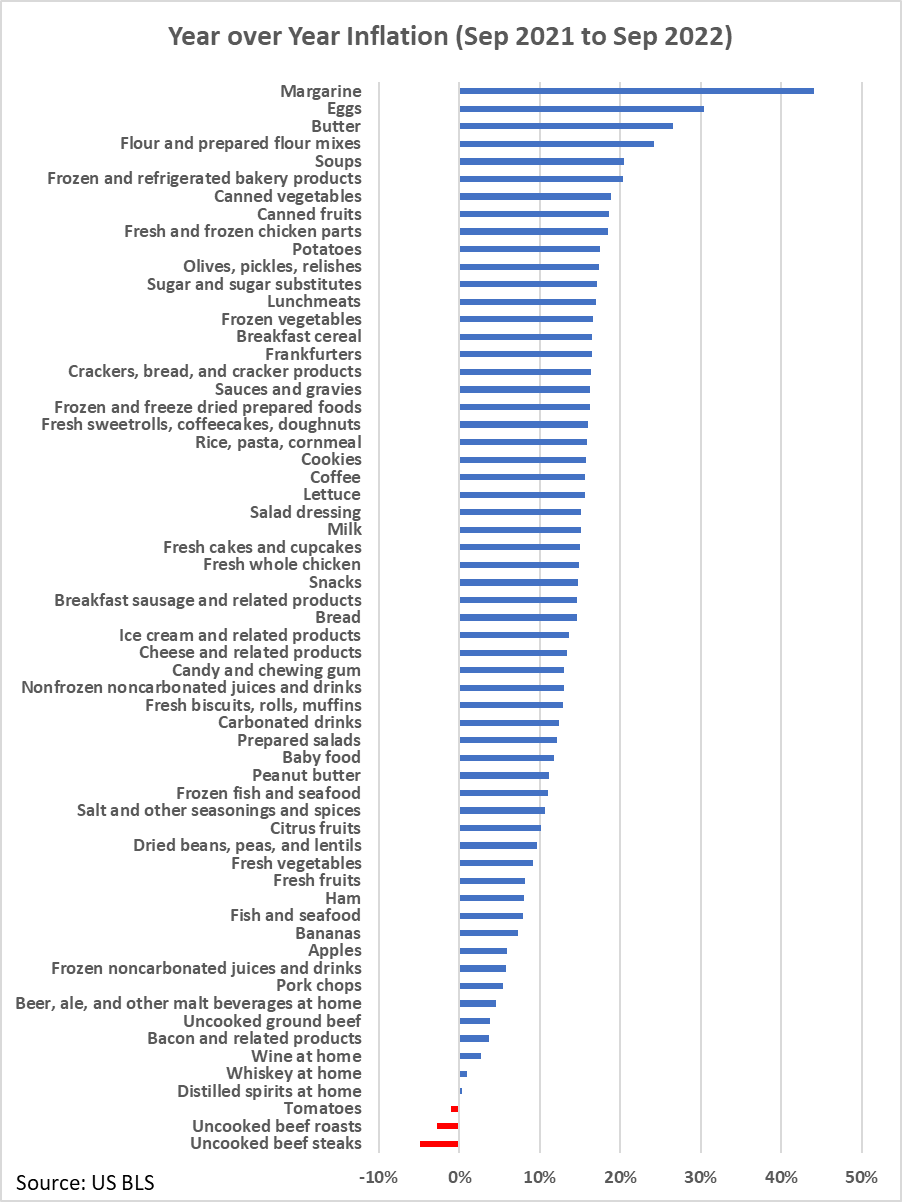
Figure 3.Year of Year Inflation (Sep 2021 to Sep 2022)
Figure 4 shows changes in major retail food items for the two-year period from September 2020 to September 2022. Again, we see fats including margarine and butter near the top of the list. They are joined by chicken and eggs, two products that historically were very affordable, so the small increase in absolute prices lead to large percentage increases. Furthermore, the HPAI impacted the egg industry, though the broiler industry has been less affected by the disease thus far.
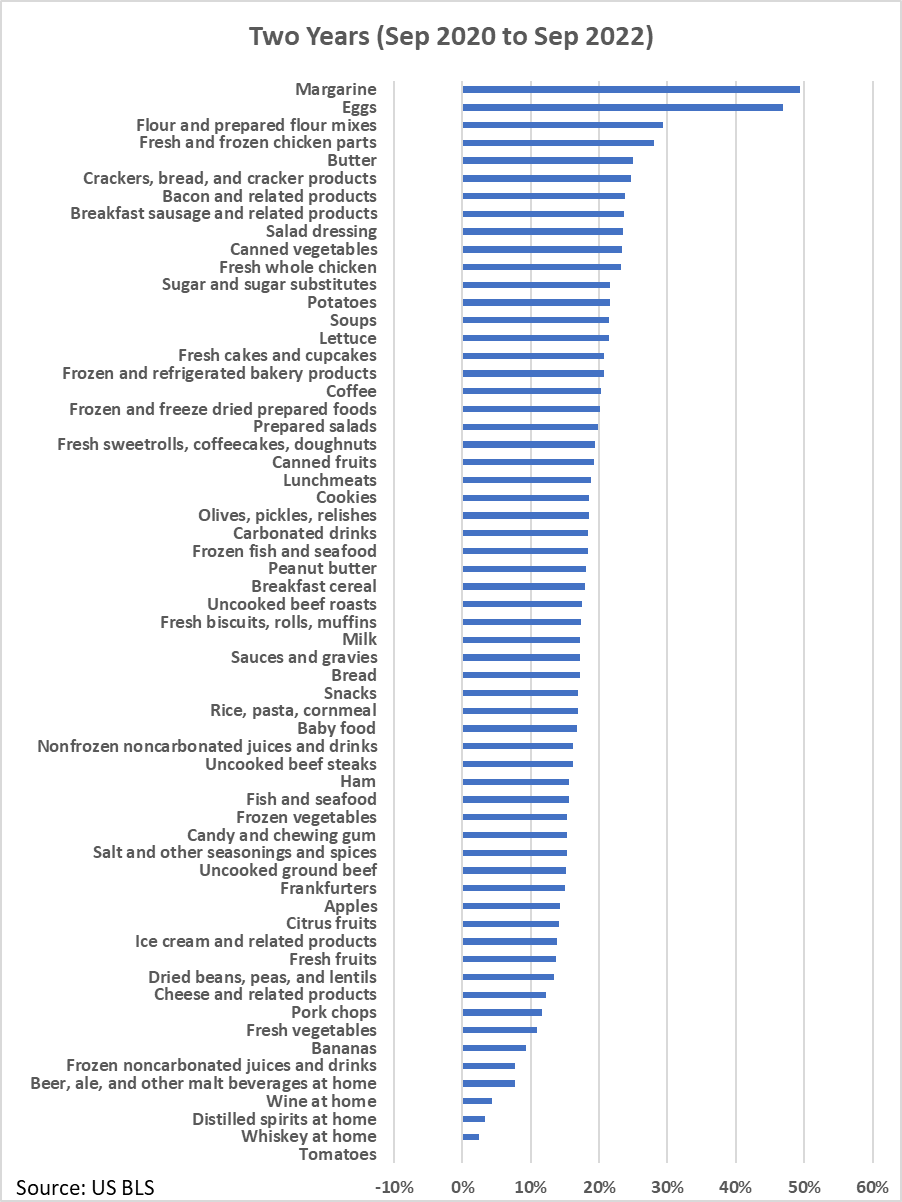
Figure 4. Two Year Inflation (Sep 2020 to Sep 2022)
As expected, food inflation has affected the purchasing habits of American consumers. The University of Purdue Center for Food Demand Analysis and Sustainability surveyed consumers in February 2022 and July 2022. Table 1 shows the results of their survey which asked consumers, “Food prices have risen about 12% over the past year. How have you changed your grocery shopping?”.
In July, consumers were more likely to have changed their purchasing habits. Only 22% of consumers said they have not altered their purchasing habits at all, down from 31% in Feb. Furthermore, 22% of consumers said they switched to generic brands, up from 13% in Feb. Both indicate consumers are looking for ways to save money on food expenditures as inflation drives food prices up.
Table 1. Changes to Grocery Shopping in Response to Food Inflation

Economic analysis provided by Aaron Gerdts, Research Analyst, Decision Innovation Solutions on behalf of Iowa Farm Bureau.
Want more news on this topic? Farm Bureau members may subscribe for a free email news service, featuring the farm and rural topics that interest them most!