2026 U.S. Prospective Planting Report
Author
Published
4/2/2026
The USDA released the expected planted acreage on March 31st, 2026.
Intended corn planted acreage in the U.S. for 2026 is 95.3 million acres, down 3.5% from final acres planted in 2025, but 1.4% above the February Outlook of 94.0 million acres (Table 1). The USDA’s corn acreage projection fell slightly below average trade expectations of 94.4 million acres. U.S. intended soybean planted acreage for 2026 is 84.7 million acres, up 4.3% from final acres planted in 2025, but down 0.4% from the USDA Outlook in February. Prospective soybean planted acres fell slightly below analysts’ expectations of 85.5 million acres. The USDA’s intended wheat planted acreage is expected to decrease by 3.3% from 2025 final acres planted to 43.8 million acres and 2.7% below the acreage reported in February’s USDA Outlook report. Intended planted acres fell 1.0 million acres short of average trade expectations.
Table 1. Intended Field Crop Acreage vs. Trade Expectations

In 2025, the Prospective Plantings report significantly underestimated final corn acreage in the U.S. This year’s March forecast of corn planted acres of 95.3 million acres is actually up 12,000 acres from the 2025 March estimate even though it is down 3.5 million acres from actual planted corn acres in 2025. This marks the third consecutive year that estimated corn acreage has increased (Figure 1). This is the largest projected Prospective Plantings’ corn acreage since 2020, when the USDA estimated acreage to be nearly 97.0 million acres.
Estimated 2026 soybean planted acreage increased by 1.2 million acres from the USDA’s 2025 March acreage forecast, but under the five-year average of 87.2 million acres. Intended wheat acreage is down 1.6 million acres to 4.8 million acres from 2025. This continues the downward trend wheat acreage has experienced since 2023.
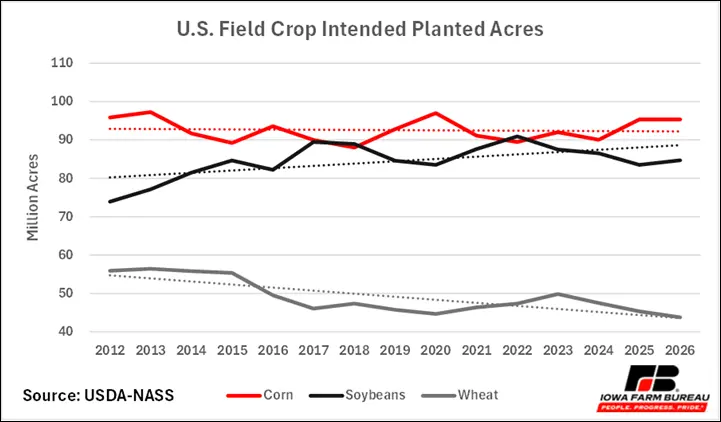
Figure 1. Annual U.S. Corn, Soybean, and Wheat Intended Planted Acres
Iowa is projected to plant 13.1 million acres of corn, down 400,000 acres or 2.9% from 13.5 million intended planted acres last year (Figure 2) and down 450,000 acres from actual corn acreage planted in 2025. In 2026, Iowa is estimated to plant 9.9 million acres of soybeans, an increase of 300,000 acres or 3.1% from 2025’s March forecast and 450,000 more acres than were actually planted in Iowa in 2025.
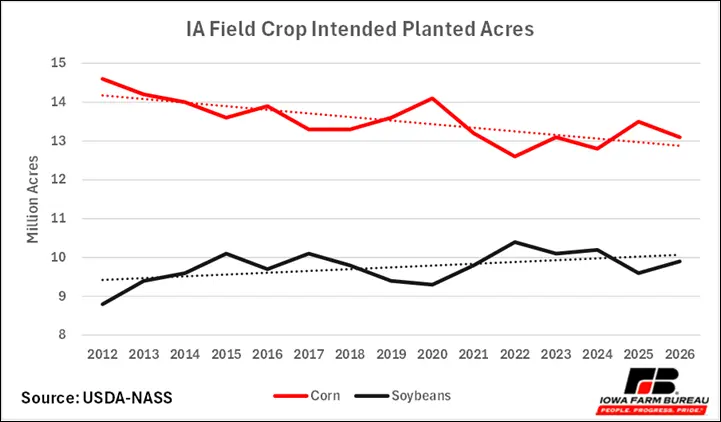
Figure 2. Annual Iowa Corn and Soybean Intended Planted Acres
The USDA reports that planted corn acreage is expected to decrease or remain unchanged in 37 of the 48 estimated states (Figure 3). Notable corn producing states that are estimated to have a decrease in acreage include South Dakota (-8.7%), Nebraska (-4.4%), Minnesota (-3.5%), and Illinois (-2.8%). Iowa, the largest corn producing state is expecting to lose 450,000 acres while Kansas’ planted corn acres are projected to increase by 3.5% (+250,000 acres) to 7.1 million acres.
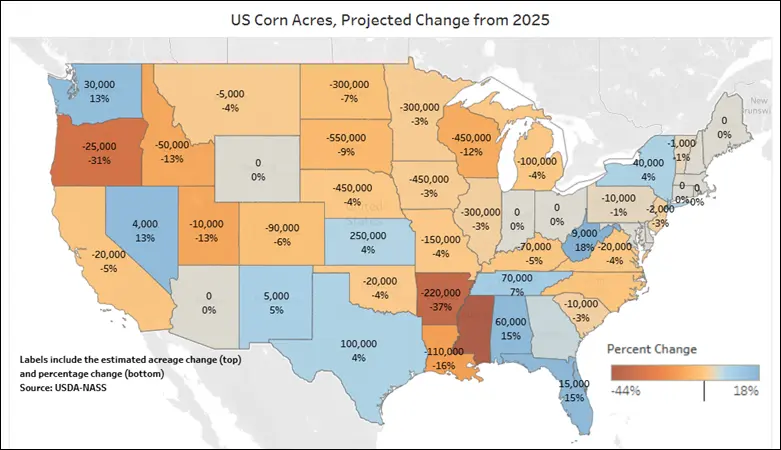
Figure 3. U.S. Corn Acres, Projected Change from Final 2025 Acres
U.S. soybean planted acres is estimated to be 84.7 million acres with 18 of the 29 estimating states expecting an increase in acreage (Figure 4). Notable soybean producing states that are projecting an increase in acreage include South Dakota (8.9%), Iowa (4.5%), North Dakota (2.2%), and Minnesota (2.1%). Illinois, the largest soybean producing state is estimating an additional 200,000 soybean acres. Ohio (-2.1%), Missouri (-1.8%), and Michigan (-1.5%) are states with over 2.0 million soybean acres that are projecting a decline in acreage.
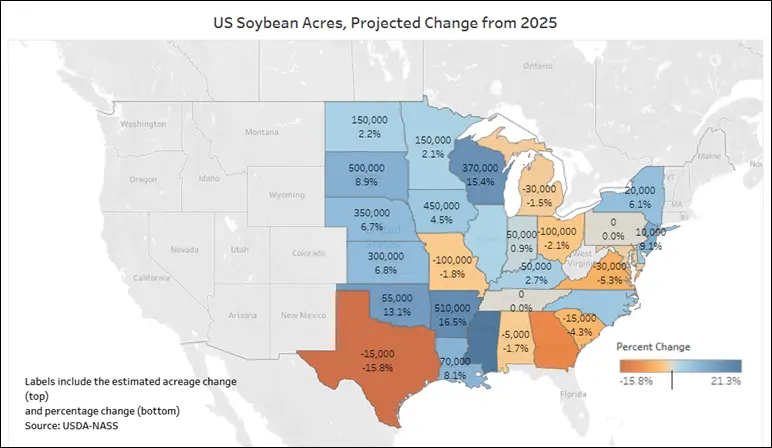
Figure 4. U.S. Soybean Acres, Projected Change from Final 2025 Acres
Initial Market Reaction
Corn futures increased by 6-7 cents initially, but dropped and fluctuated until the market closed. May corn futures initially increased to $4.61 before closing at $4.57. July corn futures first rose to $4.72 and closed at $4.68. September corn futures initially rose to $4.74 and finished the day at $4.70. December corn futures jumped to $4.87 before closing at $4.84.
Soybean futures initially increased by 15-16 cents before fluctuating and peaked at about 4-6 cents more than it closed. May soybean futures initially increased to $11.73, peaked at $11.77, and closed at $11.71. July soybean futures first increased to $11.89, peaked at $11.92, and closed at $11.86. August soybean futures initially rose to $11.86, peaked at $11.89, and closed at $11.83. September soybean futures first jumped up to $11.61, peaked at $11.64, and closed at $11.58. November soybean futures initially increased to $11.60, peaked at $11.63, and closed at $11.57.
Want more news on this topic? Farm Bureau members may subscribe for a free email news service, featuring the farm and rural topics that interest them most!