2023 Acreage and Grain Stocks Reports
Author
Published
6/30/2023
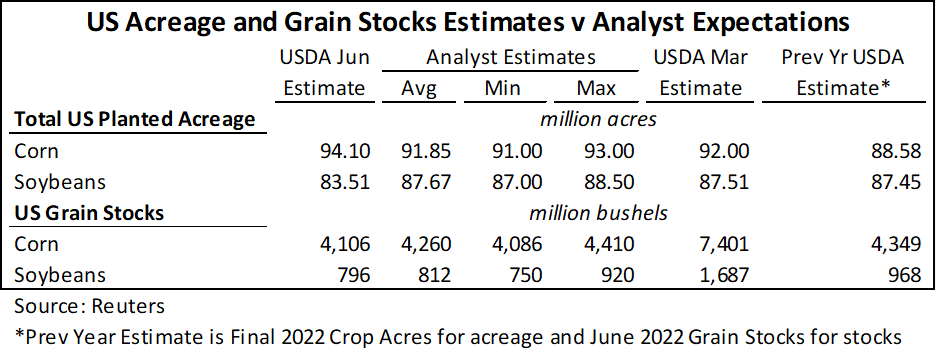
The USDA released update estimates of grain stocks and planted acres on June 30, 2023. Table 1 shows the USDA’s acreage and stocks estimates as well as USDA march planted acreage estimates for March. USDA grain stocks estimates for March are not shown as stocks are not comparable with June estimates.
The USDA reported a bigger increase in corn acres and drop in soybean acres compared to what the market was expecting. Compared to the March 2023 report, market expectations headed into the reports showed analysts expected a small decrease in corn acres and small increase in soybean acres. That is not what happened. The June Acreage Report shows a large increase in corn acreage and a large decline in soybean acres. This is a very bullish story for soybeans especially given the significant area of soybeans now in drought areas. This is being interpreted as quite negative for corn, at least in the short-run, even though nearly 70% of corn acres are in drought stricken areas.
USDA grain stocks estimates for corn and soybeans were both lower than the market expected. This again adds to the bullish story of soybeans. While lower corn stocks alone would be a bullish story, the large increase in planted acres is more than counteracting the bullish stocks and usage story in corn, especially for new crop corn.
Table 1. US Acreage and Grain Stocks Estimates v Analyst Expectations
State Level Acreage Changes
With corn acres significantly increasing and soybean acres significantly decreasing, there are not a lot of differences between states. For the most part most major corn and soybean states gained corn and lost soybeans.
Figure 1 shows the change in corn acres from the March Planting Intentions report for the 18 largest corn producing states. Of the 18 states 4 saw decreases in corn acres compared to the report, 3 saw no change, and the remaining 11 saw increases to corn acres. Illinois and Texas same the largest increases in corn acres and Iowa and South Dakota each added 300,000 acres.
Earlier this spring there was some concern regarding northern plains states, especially that North Dakota would not get all its intended corn acres in the ground. North Dakota proved these concerns were unneeded as it surpassed the intended acreage estimate some thought it would have difficulty reaching.
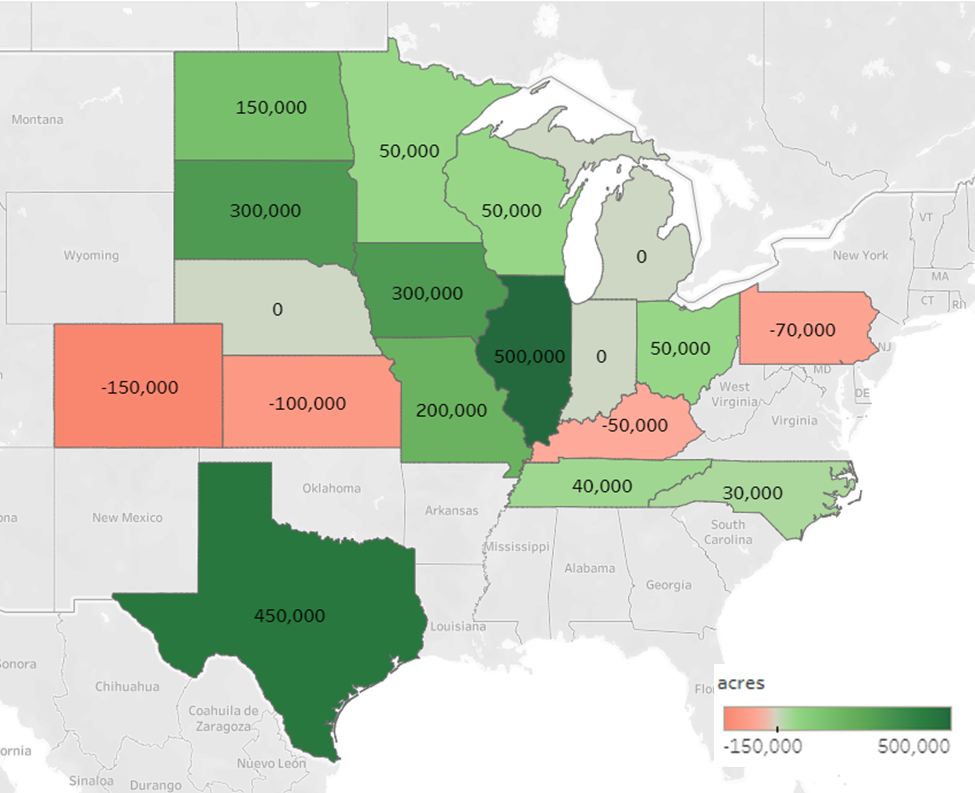
Figure 1. US Corn Acres, Change from March Acreage Estimate
Figure 2 shows the change in soybean acres from the March Planting Intentions report for the 18 largest soybean producing states. No major soybean producing state had an increase in soybean acres, 3 states’ acreage was unchanged, and the remaining 15 saw increases. While North Dakota surpassed its corn acreage intention, it was unable to surpass its soybean intention, which was also relatively aggressive. In March, North Dakota soybean acreage intentions showed a 850,000 acre increase over 2022. However, the June report showed North Dakota planted acres ended up 50,000 acres below 2022. Illinois was another state that saw a large reduction in soybean acres compared to the March intentions report. Iowa planted 400,000 less soybean acres than indicated by March intentions.
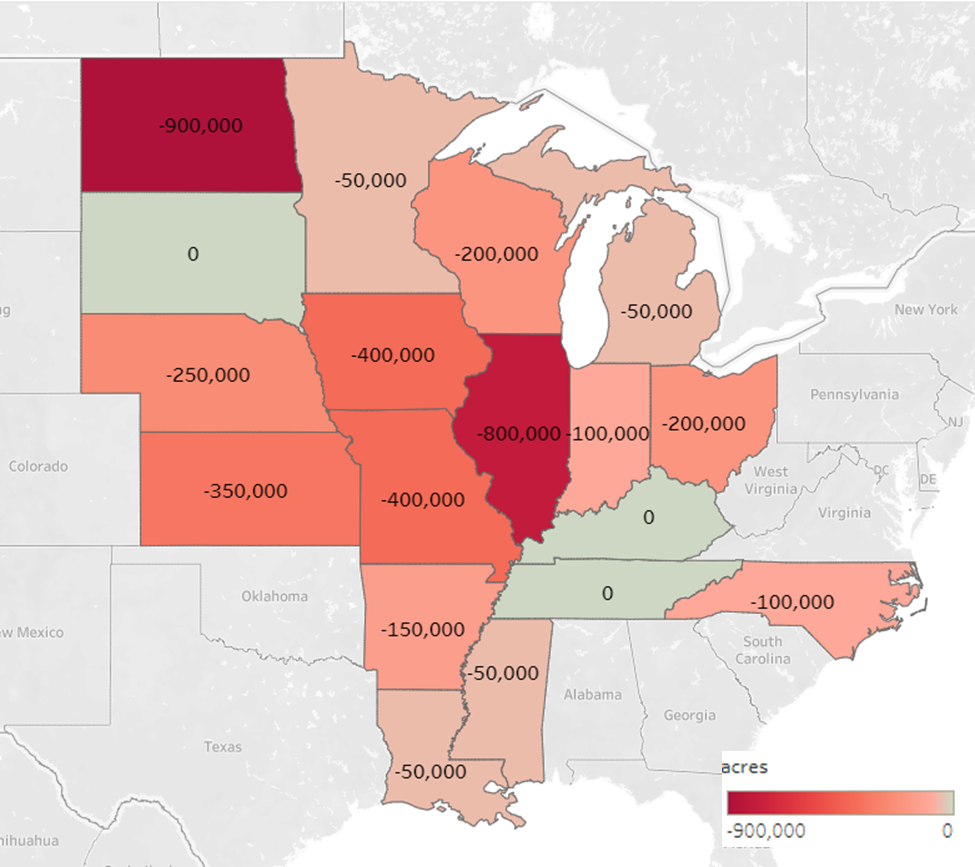
Figure 2. US Soybean Acres, Change from March Acreage Estimate
Grain Stocks by State
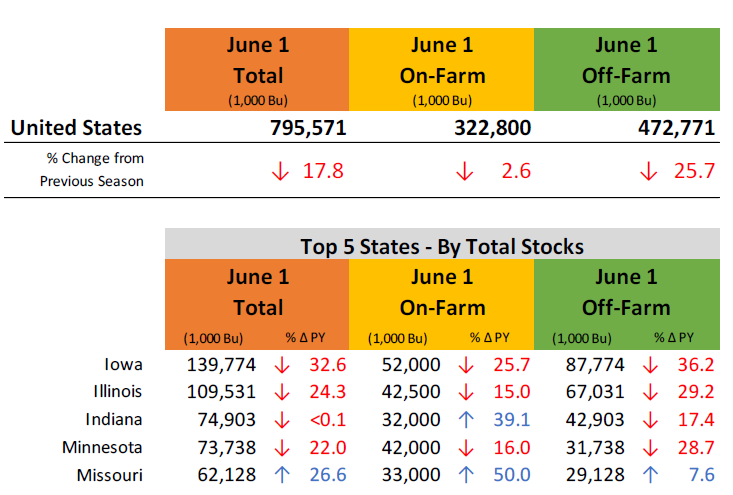
As mentioned above, total stocks were down for both corn and soybeans. Table 2 and Table 3 are USDA tables outlining stocks on-farm vs. off-farm for corn and soybean respectively. On-farm corn stocks were higher across the US than the same time last year despite lower total stocks. Iowa, Minnesota, and Indiana all have significantly more corn on farm this year as opposed to last year, while Illinois and Nebraska have less. Off-farm corn stocks levels are down nationally and in all 5 major corn producing states. This could keep corn basis levels strong through the summer months.
Both on-farm soybean and off-farm soybean stocks were down nationwide. Of major soybean states, Indiana and Missouri had significantly more stocks on farm this year compared to last year. Iowa, Illinois and Minnesota all had less soybeans stored on farm. With off-farm stocks being, in general, lower, this could support near-term soybean basis levels through July and into August.
Table 2. June 2023 Corn Stocks Breakdown for US and Top 5 States
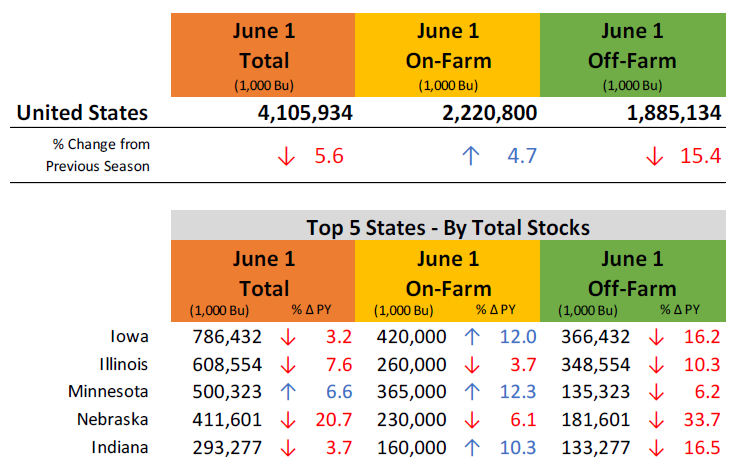
Table 3. June 2023 Soybean Stocks Breakdown for US and Top 5 States
Take Away
The USDA acreage report was a big surprise to the market. Corn acres were well above expectations and soybeans acres were well below expectations. The initial response was 75-80 cents of gain for soybean futures and 30 – 35 cents of losses for corn futures with the declines in corn futures following a week of sharply lower prices as a few showers moved across the Midwest. The acreage report will create the setting for a longer-term bearish story for corn unless yield expectations significantly deteriorate and a longer-term bullish story for soybeans.
Stocks were lower than expected for both corn and soybeans, but not as large of a shock given both fell within market analysts’ range of expectations, albeit at the low end. This news increases the bullish story for soybeans and may slightly lessen the blow to corn prices created by the large increase in estimated planted acres. The shock of the June Acreage Report sets the stage for more volatility in corn and soybean prices as we get the first official estimates of yields from USDA in the coming months.
Economic analysis provided by Aaron Gerdts, Research Analyst, Decision Innovation Solutions on behalf of Iowa Farm Bureau.
Want more news on this topic? Farm Bureau members may subscribe for a free email news service, featuring the farm and rural topics that interest them most!